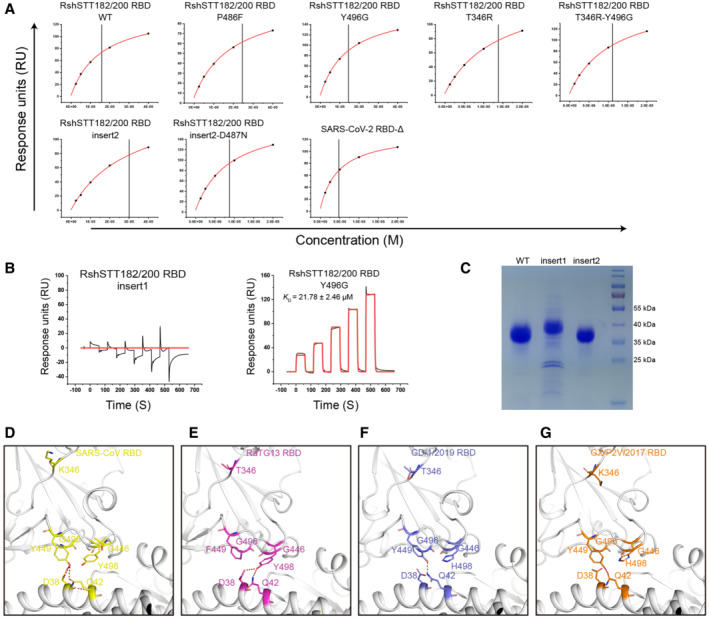
Figure EV3. SPR characterization of hACE2 binding to the RshSTT182/200 RBD and its mutants.

-
AThe steady‐state fitting curve is shown when the K D was calculated by the steady‐state model.
-
BSPR analysis of hACE2 binding to the RshSTT182/200 RBD insert1 and Y496G. The raw and fitted curves are displayed as black and red lines, respectively.
-
CSDS–PAGE showing the difference in molecular weight among RshSTT182/200 RBD‐WT, RBD‐insert1, and RBD‐insert2.
-
D–GThe H‐bond interactions of the β4β5 loop region of the SARS‐CoV RBD, RaTG13 RBD, GD/1/2019 RBD, and GX/P2V/2017 RBD are shown.
Source data are available online for this figure.
