Figure 1.

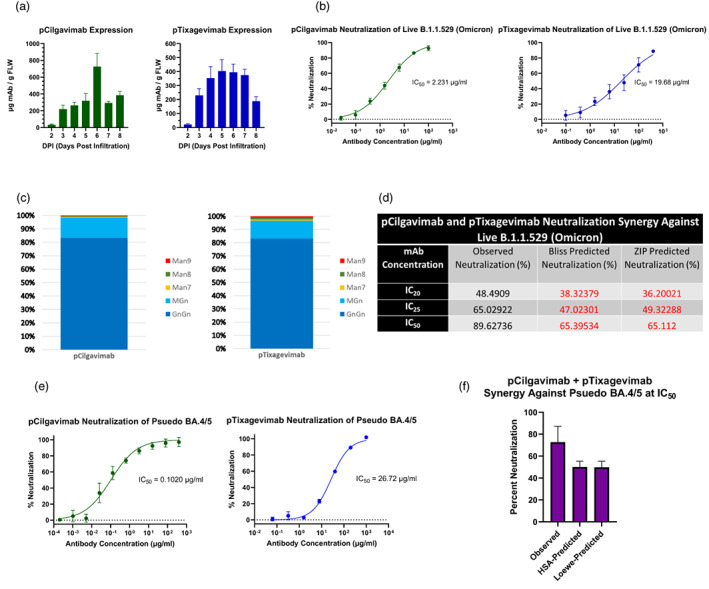
(a) Temporal expression of pCilgavimab and pTixagevimab in ΔXFT N. benthamiana plants. Data shown are in micrograms of mAb per gram of fresh leaf weight (FLW). DPI is days post‐agroinfiltration. (b) Neutralization analysis by foci‐forming assay for pCilgavimab and pTixagevimab against the live B.1.1.529 (Omicron) variant of SARS‐CoV‐2. The half maximal inhibitory concentration (IC50) value for each curve is indicated in the graph. Error bars are standard deviation and represent two independent experiments performed in triplicate. (c) Mass spectrometry analysis of pCilgavimab and pTixagevimab Fc glycosylation. Proportions of each glycan are represented as a percent of the total glycosylated Fc. GnGn, biantennary N‐actelyglucosamine; MGn, monoantennary N‐acetylglucosamine; Man9/8/7, mixed oligomannosidic structure. (d) Neutralizing synergy of the pCilgavimab and pTixagevimab cocktail against live B.1.1.529 (Omicron) variant. ZIP, zero interaction potency; IC20, IC25 and IC50: 20%, 25% and 50% inhibitory concentration, respectively. The predicated neutralization values were calculated from the neutralization data of each individual mAb in the cocktail and represent percent neutralization where there is no synergistic interaction between different mAbs. (e) Neutralization curves generated from a luciferase reporter assay for pCilgavimab and pTixagevimab against a BA.4/5 SARS‐Cov‐2 pseudovirus. IC50 value for each curve is indicated. (f) Percent neutralization of the combination of pCilgavimab and pTixagevimab at their respective IC50 concentrations against BA.4/5 SARS‐CoV‐2 pseudovirus. Both the observed and predicted percent neutralization from the HSA and Loewe synergy models are presented. Error bars in all graphs are standard deviation and represent at least two independent experiments performed in at least duplicates.
