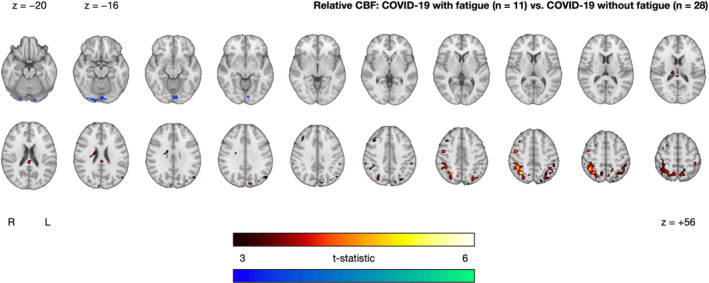
FIGURE 4.

Clusters exhibiting significantly increased (red–yellow) and decreased (blue–green) CBF in the COVID‐19 with fatigue group (n = 11) relative to the COVID‐19 without fatigue group (n = 28), after controlling for age and sex. The cluster‐extent threshold was 361 voxels. Statistical maps are presented in radiological convention. Montreal Neurological Institute coordinates are denoted by z values. R = right; L = left
