Figure 2.

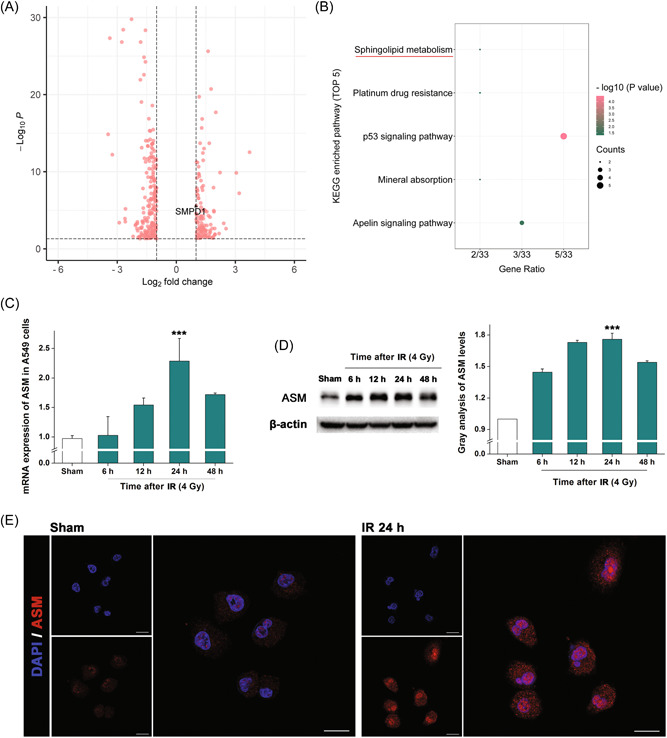
Irradiation enhances sphingolipid metabolism by upregulating acid sphingomyelinase (ASM). (A) Volcano figure of the RNA‐seq data. Shown are the altered genes in irradiated A549 cells after 24 h. (B) Top five enriched pathways in Kyoto Encyclopedia of Genes and Genomes analysis. (C) Messenger RNA expressions of ASM in irradiated A549 cells at different times. Results are shown as the mean ± SD. ***p < 0.001, relative to the sham group. (D) Western blotting analysis revealing the ASM expressions in irradiated A549 cells. β‐actin was used as the reference. Histogram shows the results of gray analysis for the protein bands. Results are shown as the mean ± SD. ***p < 0.001, relative to the sham group. (E) Immunofluorescence microscopy revealing the expressions of ASM (red) in A549 cells. Nuclei were stained with DAPI (blue). The scale bar indicates 20 μm. SD, standard deviation.
