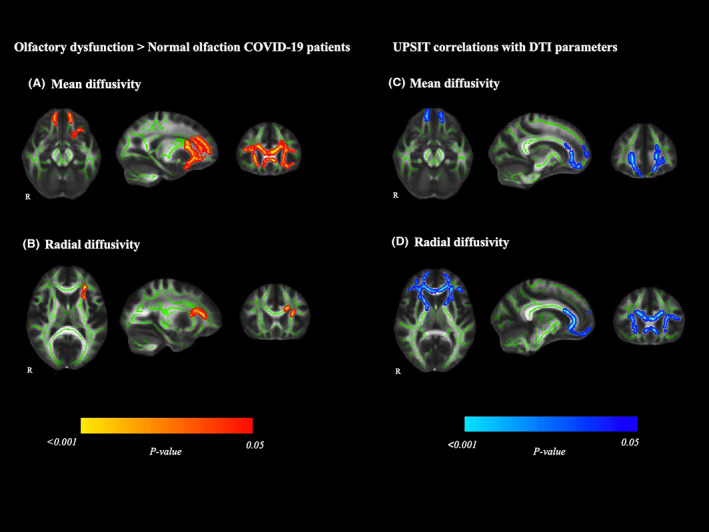
Figure 2.

White matter abnormalities in olfactory dysfunction patients compared with normal olfaction COVID‐19 patients. Images on the left show tract‐based spatial statistics differences between patients with olfactory dysfunction and those with normal olfactory function in mean diffusivity (A) and radial diffusivity (B). Voxelwise group differences (olfactory dysfunction > Normal olfaction) are marked in warm colors. Images on the right depict Tract‐based spatial statistics correlation in the whole sample of COVID‐19 patients between mean diffusivity (C), radial diffusivity (D) and the UPSIT. Significant group negative correlations are marked in cold colors. Results are overlaid on the white matter skeleton (green) and displayed over the sagittal, coronal, and axial sections of the MNI 152 standard brain at p < .05 FWE‐corrected. Image shows significant clusters >10 voxels. DTI, diffusion tensor imaging; MNI, Montreal Neurosciences Institute; R, right; UPSIT, the smell identification test.
