FIGURE 3.

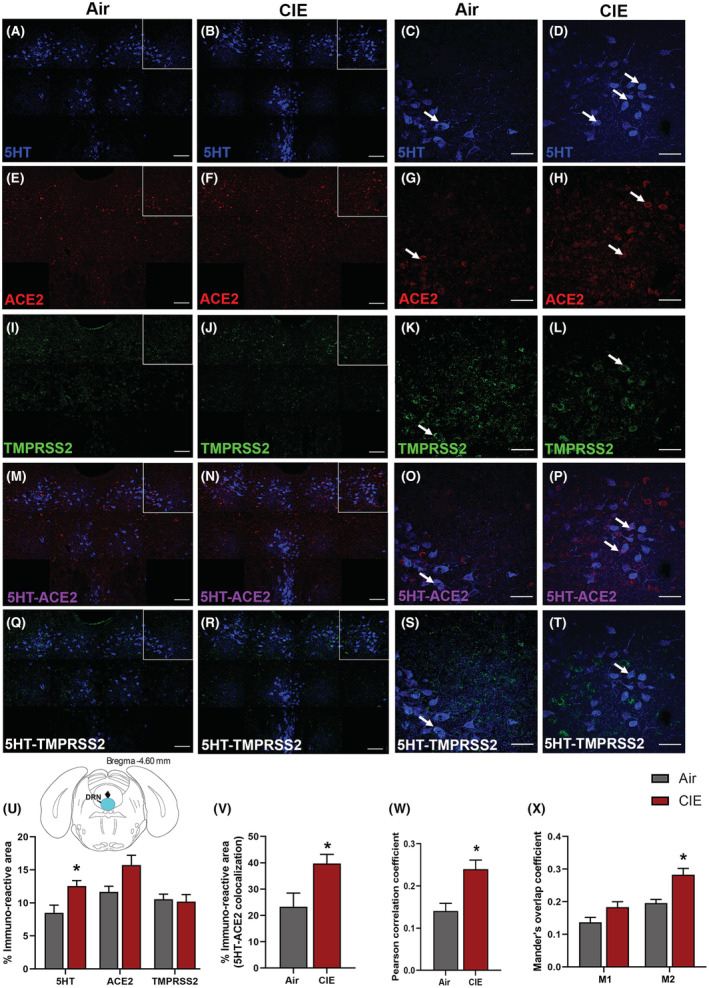
Effect of chronic intermittent EtOH (CIE) exposure on the 5HT, ACE2, and TMPRSS2 immunoreactivity in dorsal raphe nucleus (DRN). Representative confocal images showing (A, B) 5‐HT in the DRN (blue; scale bar = 100 μm) and (C, D) a single tile image (scale bar = 50 μm) from the boxed area of air control and CIE mice. (E, F) Representative images of ACE2 (red; scale bar = 100 μm) in the DRN and (G, H) a single tile image (scale bar = 50 μm) from the boxed area in air control and CIE mice. (I, J) TMPRSS2 (green; scale bar = 100 μm) in the DRN and (K, L) a single tile image (scale bar = 50 μm) from the boxed area in air control and CIE mice. (M, N) 5HT‐ACE2 (magenta) colocalization in the DRN and (O, P) a single tile image from the boxed area in air control and CIE mice. (Q, R) 5HT‐TMPRSS2 (white) positive neurons in the DRN and (S, T) a single tile image from the boxed area of air control and CIE mice. Histogram showing (U) % immunoreactive area for 5HT, ACE2, and TMPRSS2, (V) % immunoreactive area for 5HT‐ACE2 positive neurons, (W) Pearson correlation coefficient for 5HT‐ACE2 colocalization (X) Mander's overlap coefficient for 5HT‐ACE2 colocalization in DRN. Values (n = 4 to 5/group) are represented as mean (±SEM) and the data were analyzed by unpaired Student's t‐test with Welch's correction (*p < 0.05 vs. air control).
