FIGURE 5.

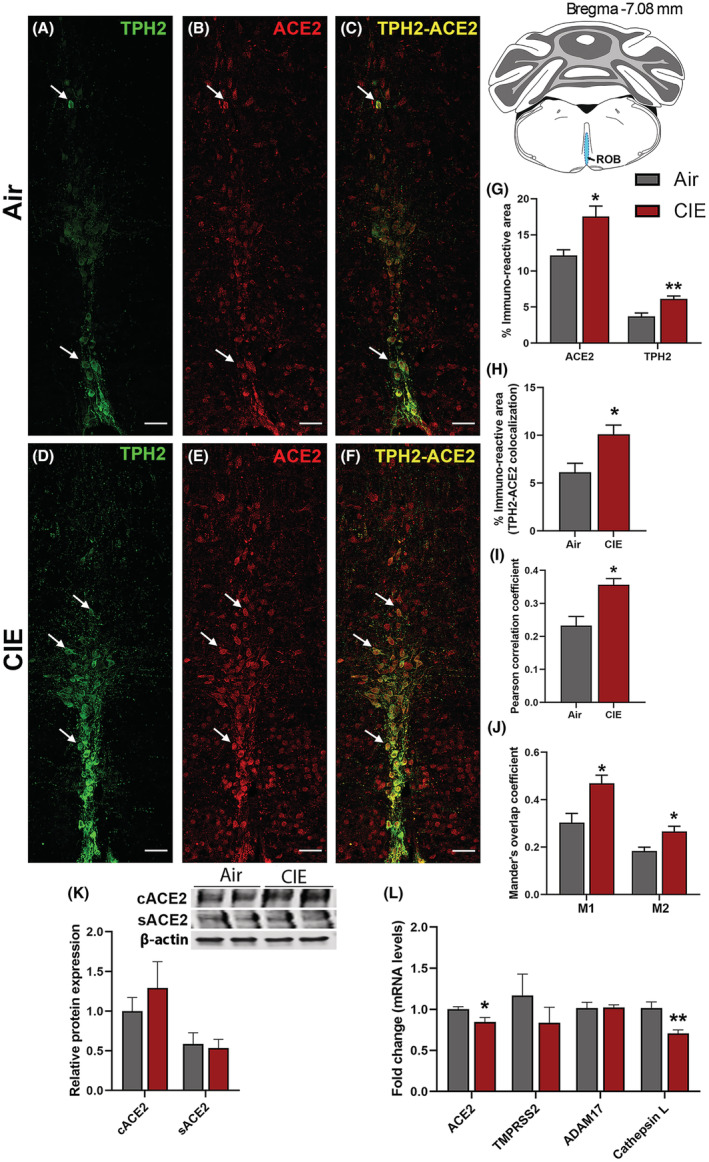
Effect of chronic intermittent EtOH (CIE) exposure on the ACE2‐TPH2 immunoreactivity in raphe obscurus (ROB) and ADAM17, TMPRSS2, and Cathepsin L expression in medullary raphe. Representative confocal images showing (A, D) TPH2 (green) (B, E) ACE2 (red) (C, F) TPH2‐ACE2 (yellow) positive neurons in ROB of air control and CIE mice. Scale bar = 50 μm. Graph showing (G) % immunoreactive area for ACE2 and TPH2, (H) % immunoreactive area for TPH2‐ACE2 positive neurons, (I) Pearson correlation coefficient for TPH2‐ACE2 colocalization (J) Mander's overlap coefficient for TPH2‐ACE2 colocalization in ROB. (K) Representative Western blot (WB) and histogram showing the cACE2 and sACE2 protein levels in the medullary raphe. (L) Histogram showing the ACE2, TMPRSS2, ADAM17, and Cathepsin L mRNA levels in the medullary raphe. Values (n = 4 to 5/group for IF and n = 7 to 8/group for WB and RT‐qPCR) are represented as mean (±SEM) and the data were analyzed by unpaired Student's t‐test with Welch's correction (*p < 0.05, **p < 0.01 vs. air control).
