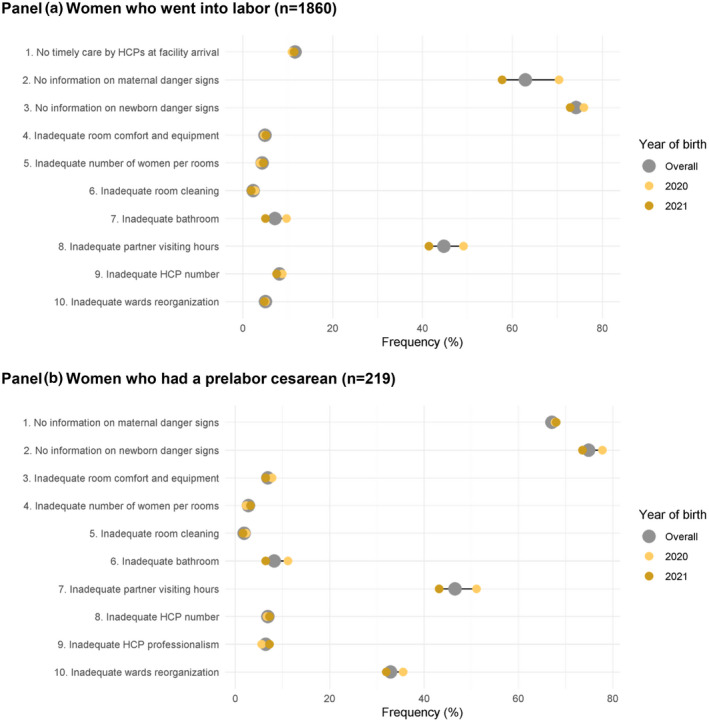
FIGURE 5.

Availability of physical and human resources. (a) Women who went into labor (n = 1860). (b)Women who had a prelabor cesarean (n = 219). HCP, healthcare provider. Note: Data are reported as frequency on the total sample (gray dot) and as frequency on the sample of women giving birth in 2020 and 2021 (colored dots). The horizontal gray line represents the range of the frequencies. All the indicators in the domain of resources are directly based on WHO standards.
