Figure 1.

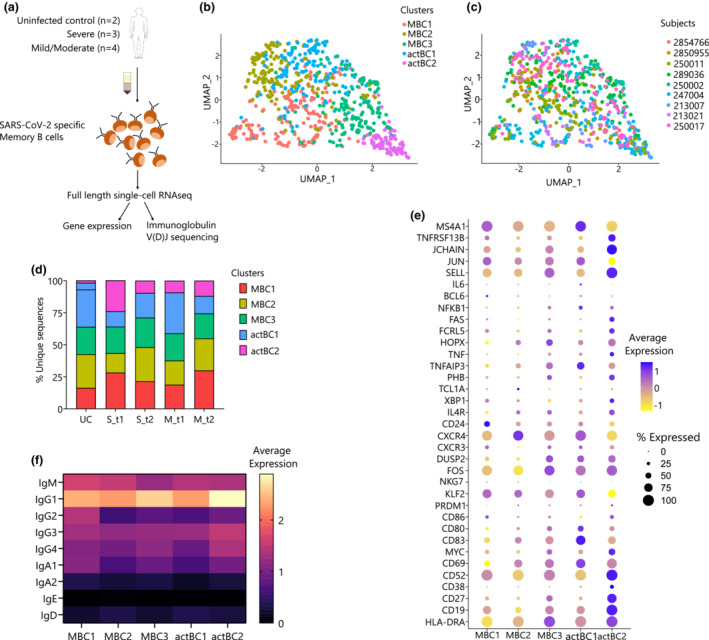
Transcriptomic analysis reveals activated receptor‐binding domain (RBD)–specific memory B cells. (a) Experimental design showing the number of patients (n = 9) and workflow used in the B cell sorting strategy and single‐cell RNA sequencing (RNA‐seq) pipeline. (b) Uniform manifold approximation projection (UMAP) generated using single‐cell RNA sequencing (RNA‐seq) of RBD‐specific memory B cells (MBCs) across five clusters (MBC1, MBC2, MBC2, actBC1 and actBC2). (c) UMAP showing distribution of nine patients across two uninfected controls (UCs; 2850955 and 2854766) and seven individuals infected with severe acute respiratory syndrome coronavirus 2 (SARS‐CoV‐2; severe, S group: 289036, 247004 and 250002, mild/moderate, M group: 250011, 213007, 250017 and 213021). (d) Stack plot showing distribution of disease severity subtypes in UC, the S group (S_t1 and S_t2) and the M group (M_t1 and M_t2). (e) Dot plot showing log‐normalized average expression (color scale) and percentage of expressing cells (size scale) of selected genes across five distinct clusters identified and named as MBC1, MBC2, MBC3, actBC1 and actBC2. (f) Average gene expression of isotype transcripts (IgG1, IgG2, IgG3, IgG4, IgA1, IgA2, IgD, IgM and IgE) across the five memory B cell clusters. Ig, immunoglobulin; actBC1, activated MBC cluster 1; actBC2, activated MBC cluster 2; MBC1, MBC cluster 1; MBC2, MBC cluster 2; MBC3, MBC cluster 3.
