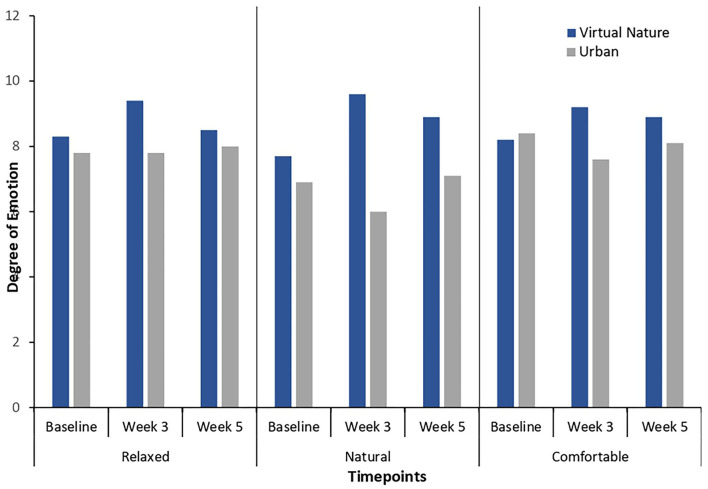
Figure 4.
Degree of relaxed, natural, and comfortable mood at baseline (T0), week 3 (T1), and week 5 (T2) in the virtual nature group and urban group. The increase in relaxed, natural mood in week 3 from the baseline in the virtual nature group reached statistical significance. Although there was a trend of increase in comfortable mood in week 3 from the baseline, that change was not statistically significant. Moreover, the levels of relaxed, natural, and comfortable mood in the virtual nature group were higher than those in the urban group in week 3. Although the differences did not reach statistical significance, there was a greater trend of a more relaxed and comfortable mood in the virtual nature group than in the urban group at the week 5.

