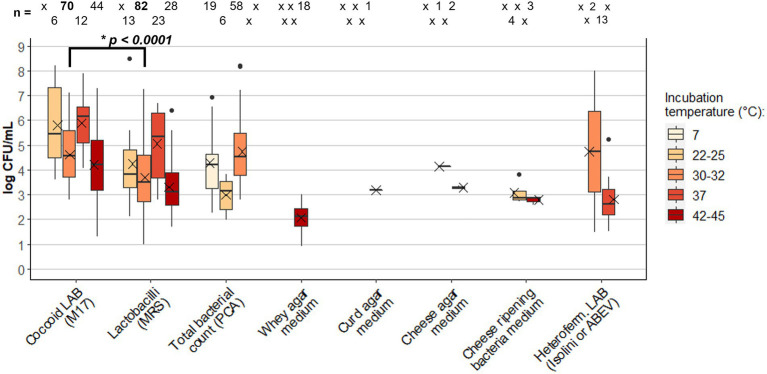
Figure 3.
Box plot of Lactic Acid Bacteria (LAB) concentration (log CFU/mL) in cheese raw milk: comparison between different growth media and incubation temperatures. Extremes of the bars represent the max. and min. Values; the box lines indicate the 1st quartile, the median, and the 3rd quartile; the mean is indicated by the X within the box; isolated data points are outliers. The number of data (n) is reported at the top of each box (x = missing data). Data were extracted from studies listed in Table 1. The value of p (*p) resulting from the t-test applied to Coccoid LAB and Lactobacilli results incubated at 30–32°C is reported (datasets are reported in Supplementary Data 1). MRS, Man-Rogosa-Sharpe; PCA, plate count agar; ABEV, Arginine Bromocresol Meat Extract Vancomycin.

