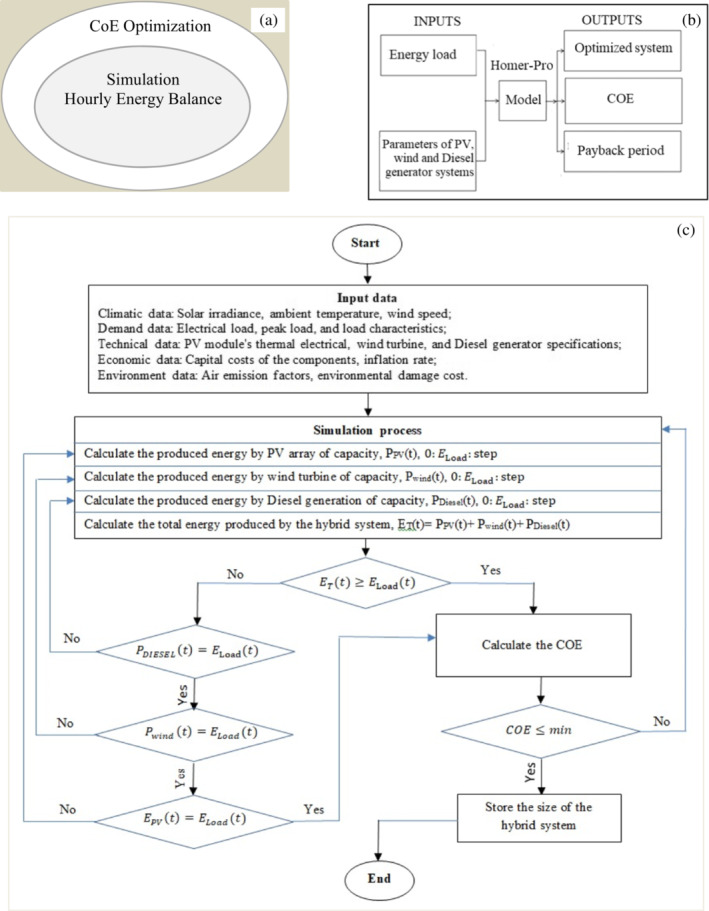
FIGURE 3.

(a) Interactions between simulation and optimization (b) key information for modeling (c) flowchart presents the optimization process used by HOMER‐Pro

(a) Interactions between simulation and optimization (b) key information for modeling (c) flowchart presents the optimization process used by HOMER‐Pro