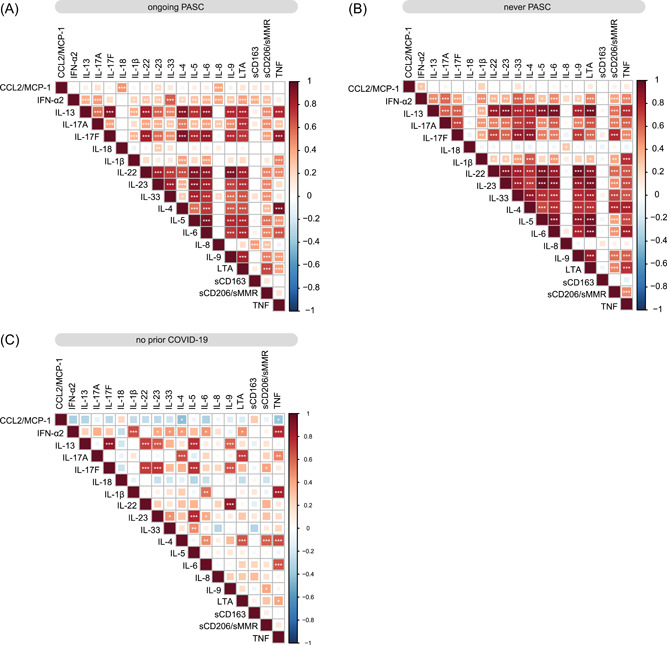
Figure 3.

Correlation analysis of plasma soluble factors. (A–C) Correlation matrix of all analyzed soluble factors for individuals with ongoing PASC (n = 91) (A), individuals who never reported PASC postinfection (n = 62) (B), or individuals with no prior COVID‐19 (n = 28) (C). PASC, postacute sequelae of COVID.
