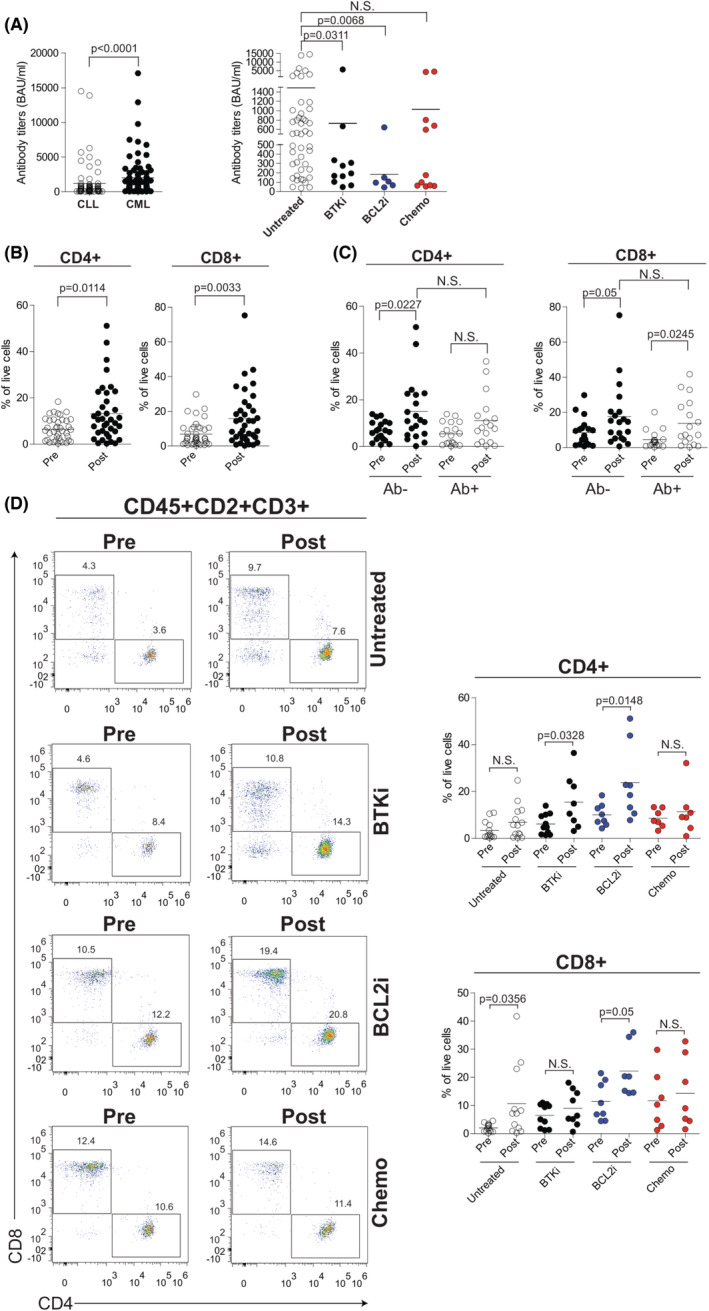
FIGURE 1.

Humoral response and T‐cell levels after SARS‐CoV‐2 vaccination in CLL. (A) Left panel, anti‐SARS‐CoV‐2 antibody levels in seroconverted patients with CLL (n = 74) or chronic myeloid leukaemia (CML) (n = 90). Right panel, anti‐SARS‐CoV‐2 antibody titres in CLL seroconverted patients from untreated (N = 46), Bruton tyrosine kinase inhibitor (BTKi) (N = 11), B‐cell lymphoma 2 inhibitor BCL2i (N = 6), and chemo (n = 11) subgroups. (B) Frequency of CD4+ (left) and CD8+ (right) T cells within the CD2+CD3+ T‐cell compartment in CLL patients before (pre) and after (post) vaccine administration. (C) Frequency of CD4+ (left) and CD8+ (right) T cells within the CD2+CD3+ T‐cell compartment, in seronegative (Ab−) and seropositive (Ab+) CLL patients before (pre) and after (post) vaccine administration. (D) Flow‐cytometric analysis of CD4+ and CD8+ T cells within the CD2+CD3+ T‐cell compartment in CLL patients per treatment status before (pre) and after (post) vaccine administration. Representative plots are shown in the left panel. Right panel, frequency of CD4+ (upper) and CD8+ (bottom) in each treatment subgroup of CLL patients. Data are presented as scatter dot plots and the mean values (horizontal lines) are shown. p value (Mann–Whitney test) is reported above each comparison. CLL, chronic lymphocytic leukaemia; N.S., not significant
