
FIGURE 3.
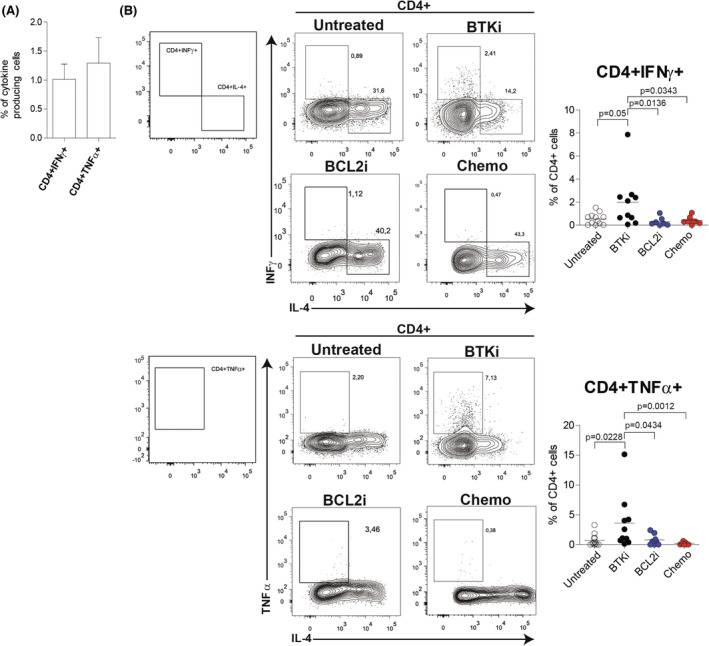
Cytokine production induced by SARS‐CoV‐2 antigenic stimulation in CD4+ T cells from vaccinated CLL patients. (A) Frequency of CD4+ T cells producing IFNγ or TNFα after SARS‐CoV‐2 antigenic peptide stimulation (N = 38) represented as mean ± standard error of the mean. (B) Flow cytometric analysis of CD4+IFNγ+ (upper panel) and CD4+TNFα+ (bottom panel) cells in CLL patients per treatment subgroup. Gating strategy (left panel) and representative plots (middle panel) are shown. Right panel, data are presented as scatter dot plots and the mean values (horizontal lines) are shown. p value (Mann–Whitney test) is reported above each comparison. CLL, chronic lymphocytic leukaemia; IFNγ, interferon gamma; N.S., not significant; TNFα, tumour necrosis factor alpha