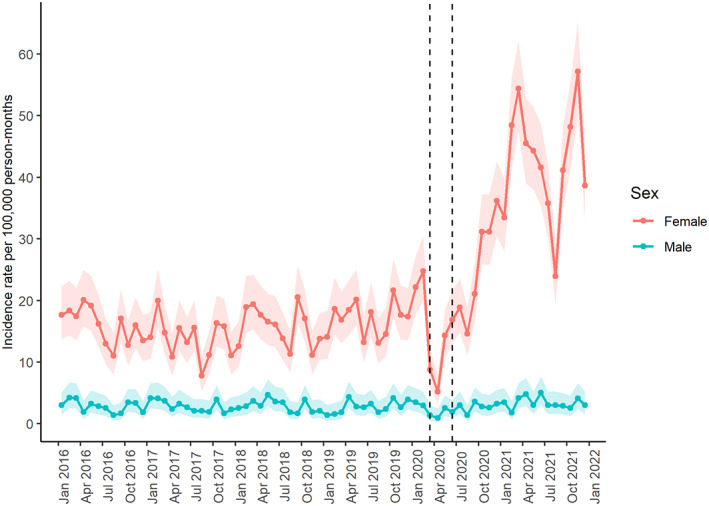
FIGURE 1.

Monthly incidence rates stratified by sex. Points indicate monthly incidence rates of eating disorders from January, 2016 to December, 2021. Shaded areas represent 95% confidence intervals. The lockdown period is delimited by two vertical lines, which indicate March, 2020 and June, 2020.
