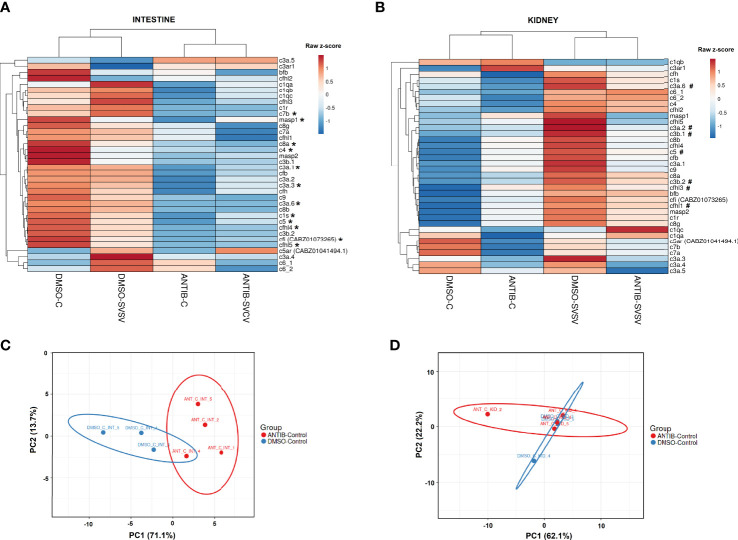
Figure 7.
Analysis of the complement components. Heatmaps representing the mean TPM values of the different complement components in the (A) intestine and (B) kidney of the four experimental groups (DMSO-C, DMSO-SVCV, ANTIB-C and ANTIB-SVCV). * Indicates statistically significant differences between the ANTIB-C and DMSO-C groups; # indicates statistically significant differences between the DMSO-SVCV and DMSO-C groups. PCA of the complement genes in the (C) intestine and (D) kidney of the DMSO-control and antibiotics-control groups.

