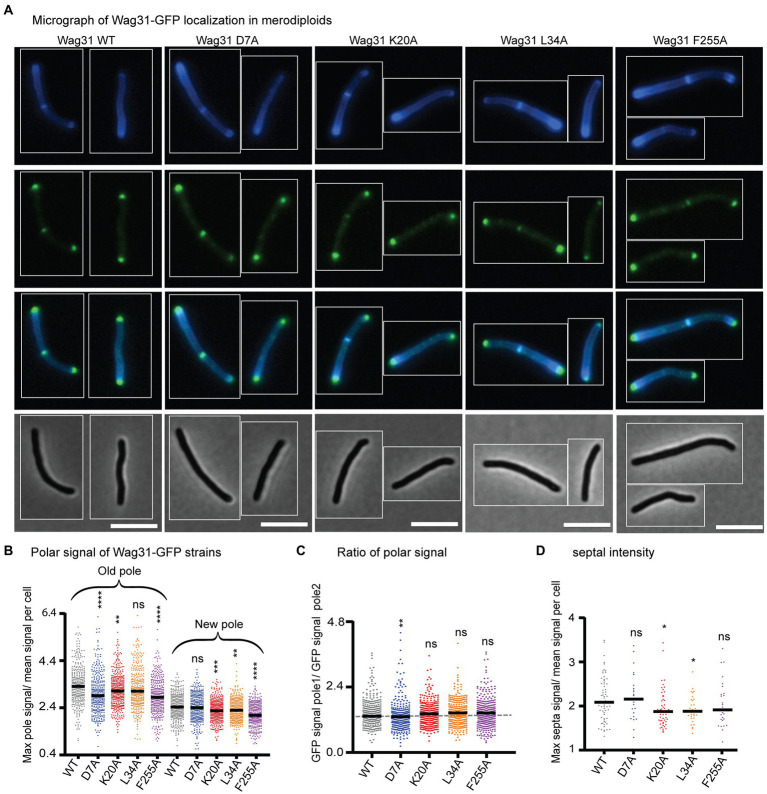
Figure 2.
Wag31 mutant proteins localize normally in merodiploid strains. (A) Micrographs of WT Msmeg expressing Wag31-GFPmut3 constructs with the indicated mutations. Top: HADA; second: GFP; third: merged; bottom: phase. The scale bar is 5 microns, and it applies to all images. (B) Relative polar intensity of GFPmut3 signal from cells in A. (C) Ratio of normalized signal at the old pole over normalized signal at the new pole, from B. (D) Relative septal intensity of GFPmut3 signal from cells in A. ns, p > 0.05, *p = <0.05, **p = <0.005, ***p = <0.0005, ****p = <0.0001. All p-values (B), (C) were calculated by one-way ANOVA, Dunnett’s multiple comparisons test and the p-values (D) were calculated by the Welch’s t-test.

