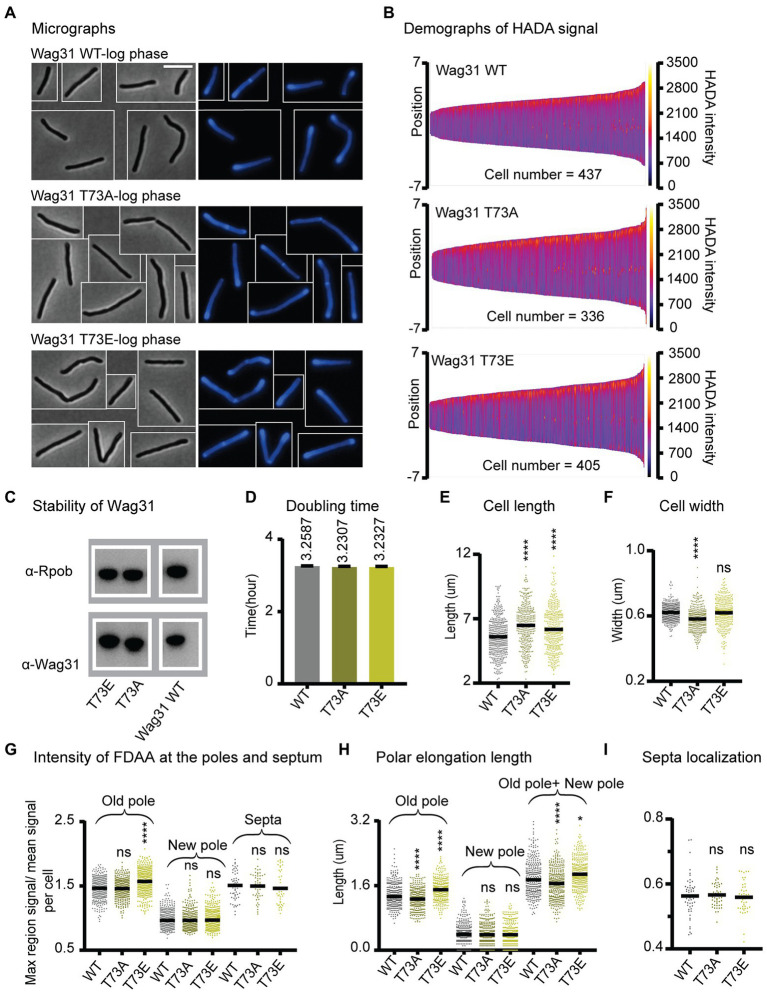
Figure 3.
Phosphorylation of T73 on Wag31 subtly affects the cell wall metabolism, but does not affect growth rate. (A) Phase (left) and fluorescence (right) images of Msmeg wag31 allele strains stained with HADA. The scale bar is 5 microns, and it applies to all images. (B) Demographs of HADA intensity (color scale) across the length of the cell (Y axis) of the wag31 allele strains. The cells were sorted by length, with shortest cells on the left and longest on the right of each demograph. Cells were also pole-sorted according to HADA intensity, such that the brighter pole (presumed to be the old pole) was oriented to the top along the Y axis. At least 100 cells were analyzed from each of three independent biological replicates of each strain. (C) Western blots of Wag31 WT, T73A, and T73E proteins in wag31 allele strains using α-Wag31 antibody. RpoB serves as a loading control. (D) Doubling times of Msmeg cells expressing WT or wag31 mutants. The means (on top of bars) are an average of three biological replicates. Error bars represent SD. (E) Cell lengths of the wag31 allele strains. Black bars are at the mean. (F) Cell widths of the wag31 allele strains. Black bars are at the mean. (G) Relative polar and septal HADA intensity of wag31 allele strains. Relative intensity is equal to the maximum signal at a cell pole, divided by the mean signal of that cell. (H) Length of polar elongation in the wag31 allele strains, as measured by the elongation assay method diagrammed in Figure 1I. (I) Septal location in wag31 allele strains. Black bar is at the median. ns, p > 0.05, ****p = < 0.0001. All p-values were calculated by one-way ANOVA, Dunnett’s multiple comparisons test.

