Figure 5.
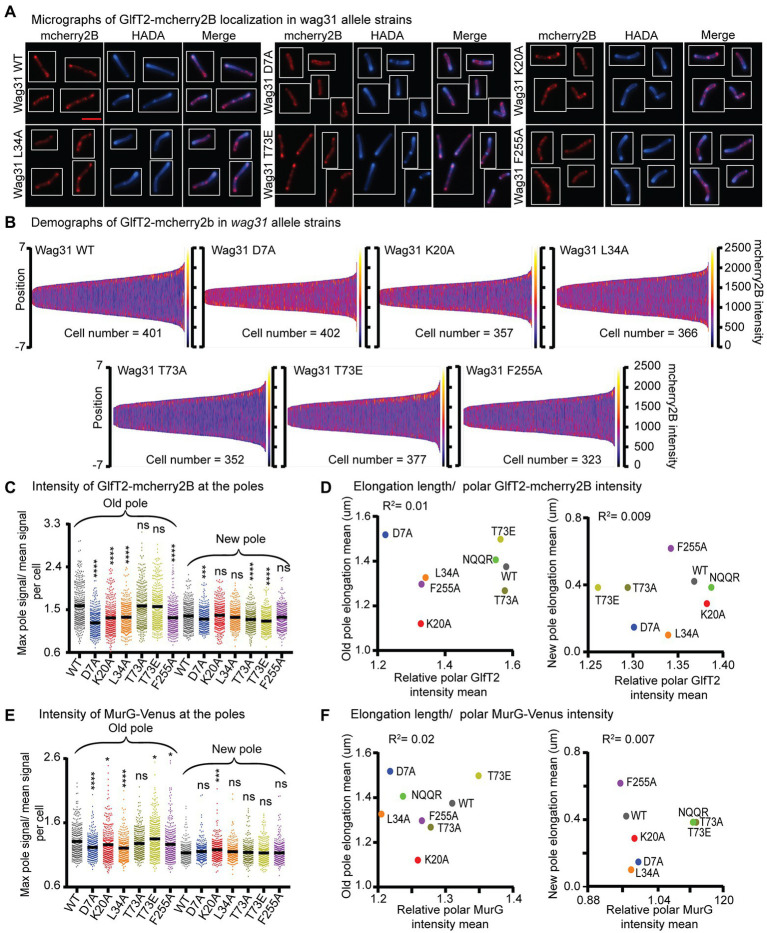
Localization of IMD proteins does not determine changes in polar growth. (A) Micrographs of wag31 allele strains expressing GlfT2-mcherry2B and stained with HADA. The scale bar is 5 microns, and it applies to all images. (B) Demographs of GlfT2-mcherry2B intensity across the length of each cell (Y axis of each plot, with intensity indicated by color – scale to the right of each plot), arranged by cell length (along the X axis). At least 100 cells were analyzed for each of three biological replicate cultures. (C) Relative polar intensity of GlfT2-mcherry2B in the Wag31 WT and Wag31 mutants at the old pole and the new pole. Relative intensity is equal to the maximum signal at a cell pole, divided by the mean signal of that cell. (D) Correlation between relative polar intensity of GlfT2-mcherry2B and elongation length (Figure 1J) at the poles. The eight mutants shown as colored dots. (E) Relative polar intensity of MurG-Venus in the Wag31 WT and Wag31 mutants at the old pole and the new pole. (F) Correlation between relative polar intensity of MurG-Venus and elongation length at the poles. ns, p > 0.05, *p = <0.05, ***p = <0.0005, ****p = <0.0001. p-values were calculated by one-way ANOVA, Dunnett’s multiple comparisons test.

