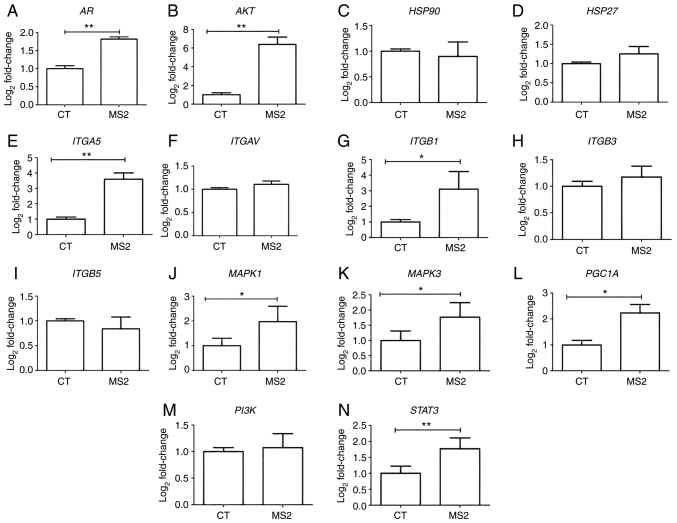
Figure 3.
Gene expression of the LNCaP prostate cancer cells after 24 h of treatment with bacteriophage MS2. The effect on the gene expression of LNCaP cells after interaction with bacteriophage MS2 was compared with that of untreated CT cells. (A) AR, (B) AKT, (C) HSP90, (D) HSP27, (E) ITGA5, (F) ITGAV, (G) ITGB1, (H) ITGB3, (I) ITGB5, (J) MAPK1, (K) MAPK3, (L) PGC1A, (M) PI3K, and (N) STAT3. Relative values of gene expression (median) are shown as Log2Fold-Change. *P<0.05 and **P<0.01 vs. control group within the same observation period, as determined using the non-parametric Kruskal-Wallis test. AR, androgen receptor; CT, control; HSP27, heat shock protein 27; HSP90, heat shock protein 90; ITGA5, integrin α5; ITGAV, integrin αV; ITGB1, integrin β1; ITGB3, integrin β3; ITGB5, integrin β5; PGC1A, peroxisome proliferator-activated receptor-γ coactivator 1α.

