Figure 3.

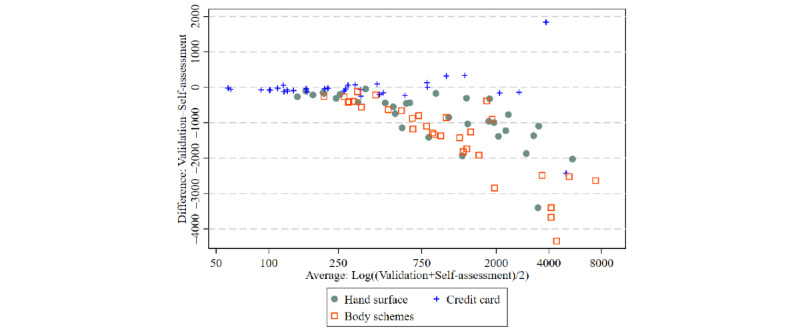
Bland-Altman plot (difference plot) of tattoo surface measured via self-assessment versus validation data for 3 different measurement units using data from the whole study population (N=97).

Bland-Altman plot (difference plot) of tattoo surface measured via self-assessment versus validation data for 3 different measurement units using data from the whole study population (N=97).