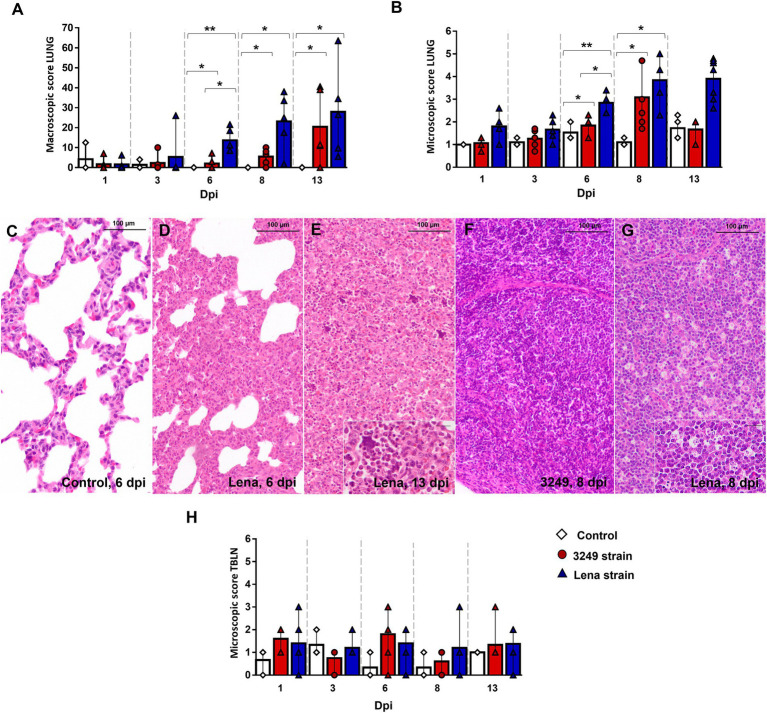
Figure 1.
Gross and histological findings in lung and tracheobronchial lymph node. Graphs represents macroscopic (A) and microscopic score in lung (B) from control (white diamonds), 3249- (red circles) and Lena- (blue triangles) infected groups. Lung from a control animal (C) and from Lena-infected animals euthanized at 6 dpi (D) and 13 dpi (E), showing severe interstitial pneumonia and bronchopneumonia, respectively. Inset shows neutrophils and cell debris filling alveolar lumen (bar 20 μm). Tracheobronchial lymph node from 3249- (F) and Lena- (G) infected animals euthanized at 8 dpi. Inset shows numerous tingible body macrophages (bar 20 μm). Graphs represents microscopic score in tracheobronchial lymph node (TBLN) (H). Columns represent the median with interquartile range (IQR). Significant differences between groups in lung are represented (* p ≤ 0.05 and ** p ≤ 0.01). Dpi, days post-infection.

