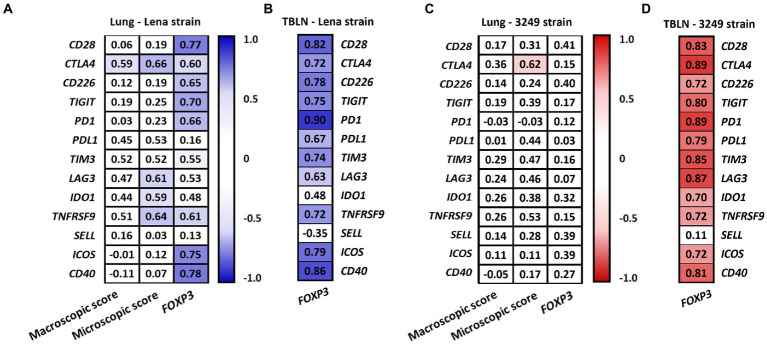
Figure 9.
Correlation found between the expression of immune checkpoints, the macroscopic and the microscopic score and the expression of FOXP3 in lung from Lena- (A) and 3249-infected group (C). Correlation found between the expression of immune checkpoints and the expression of FOXP3 in the tracheobronchial lymph node (TBLN) from Lena- (B) and 3249-infected group (D). Significant correlations for Lena and 3249 strains are represented with blue and red color, respectively (ρ > 0.55, p ≤ 0.05).

