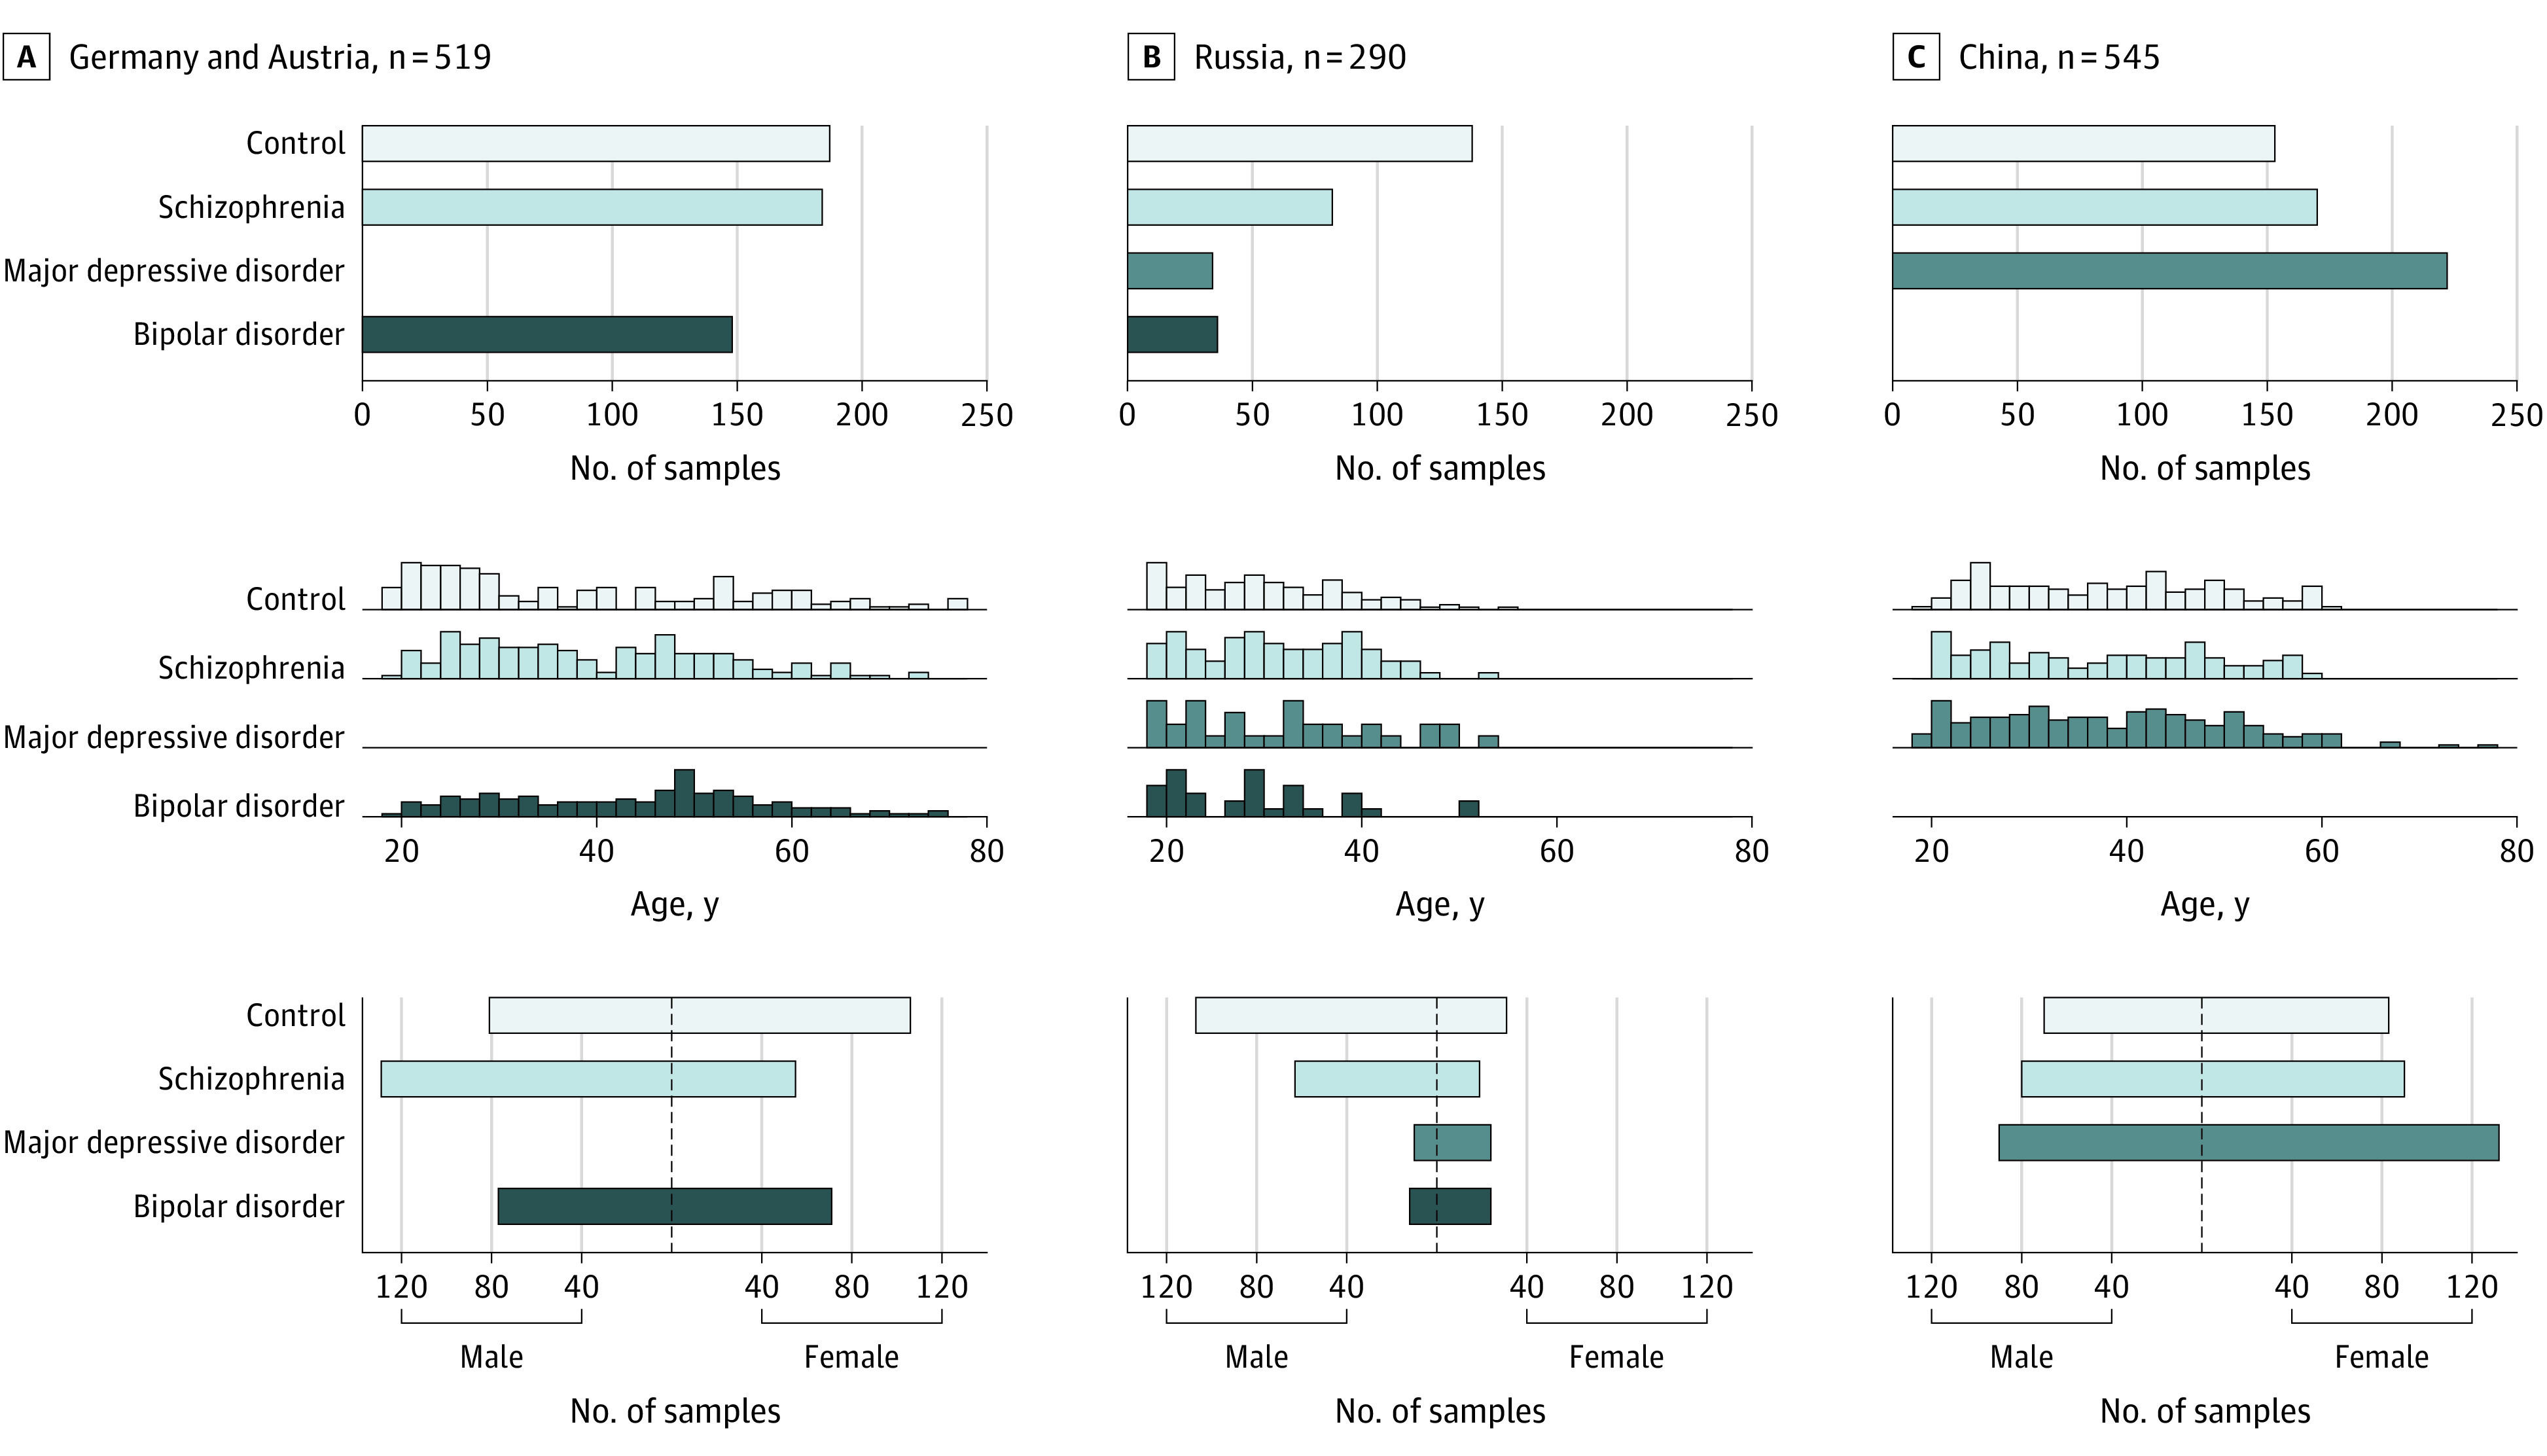
Figure 1. Three Experimental Cohorts.

Schematic representation of the 3 sampling locations, Germany and Austria (A), Russia (B), and China (C). The top of each panel shows the number of individuals sampled at the location and the number of individuals sampled for each diagnosis group: control, schizophrenia, major depressive disorder, and bipolar disorder. The middle of each panel shows the distribution of ages for the diagnosis groups within each sample cohort. The bottom of each panel shows the distribution of sex for the diagnosis groups within each sample cohort.
