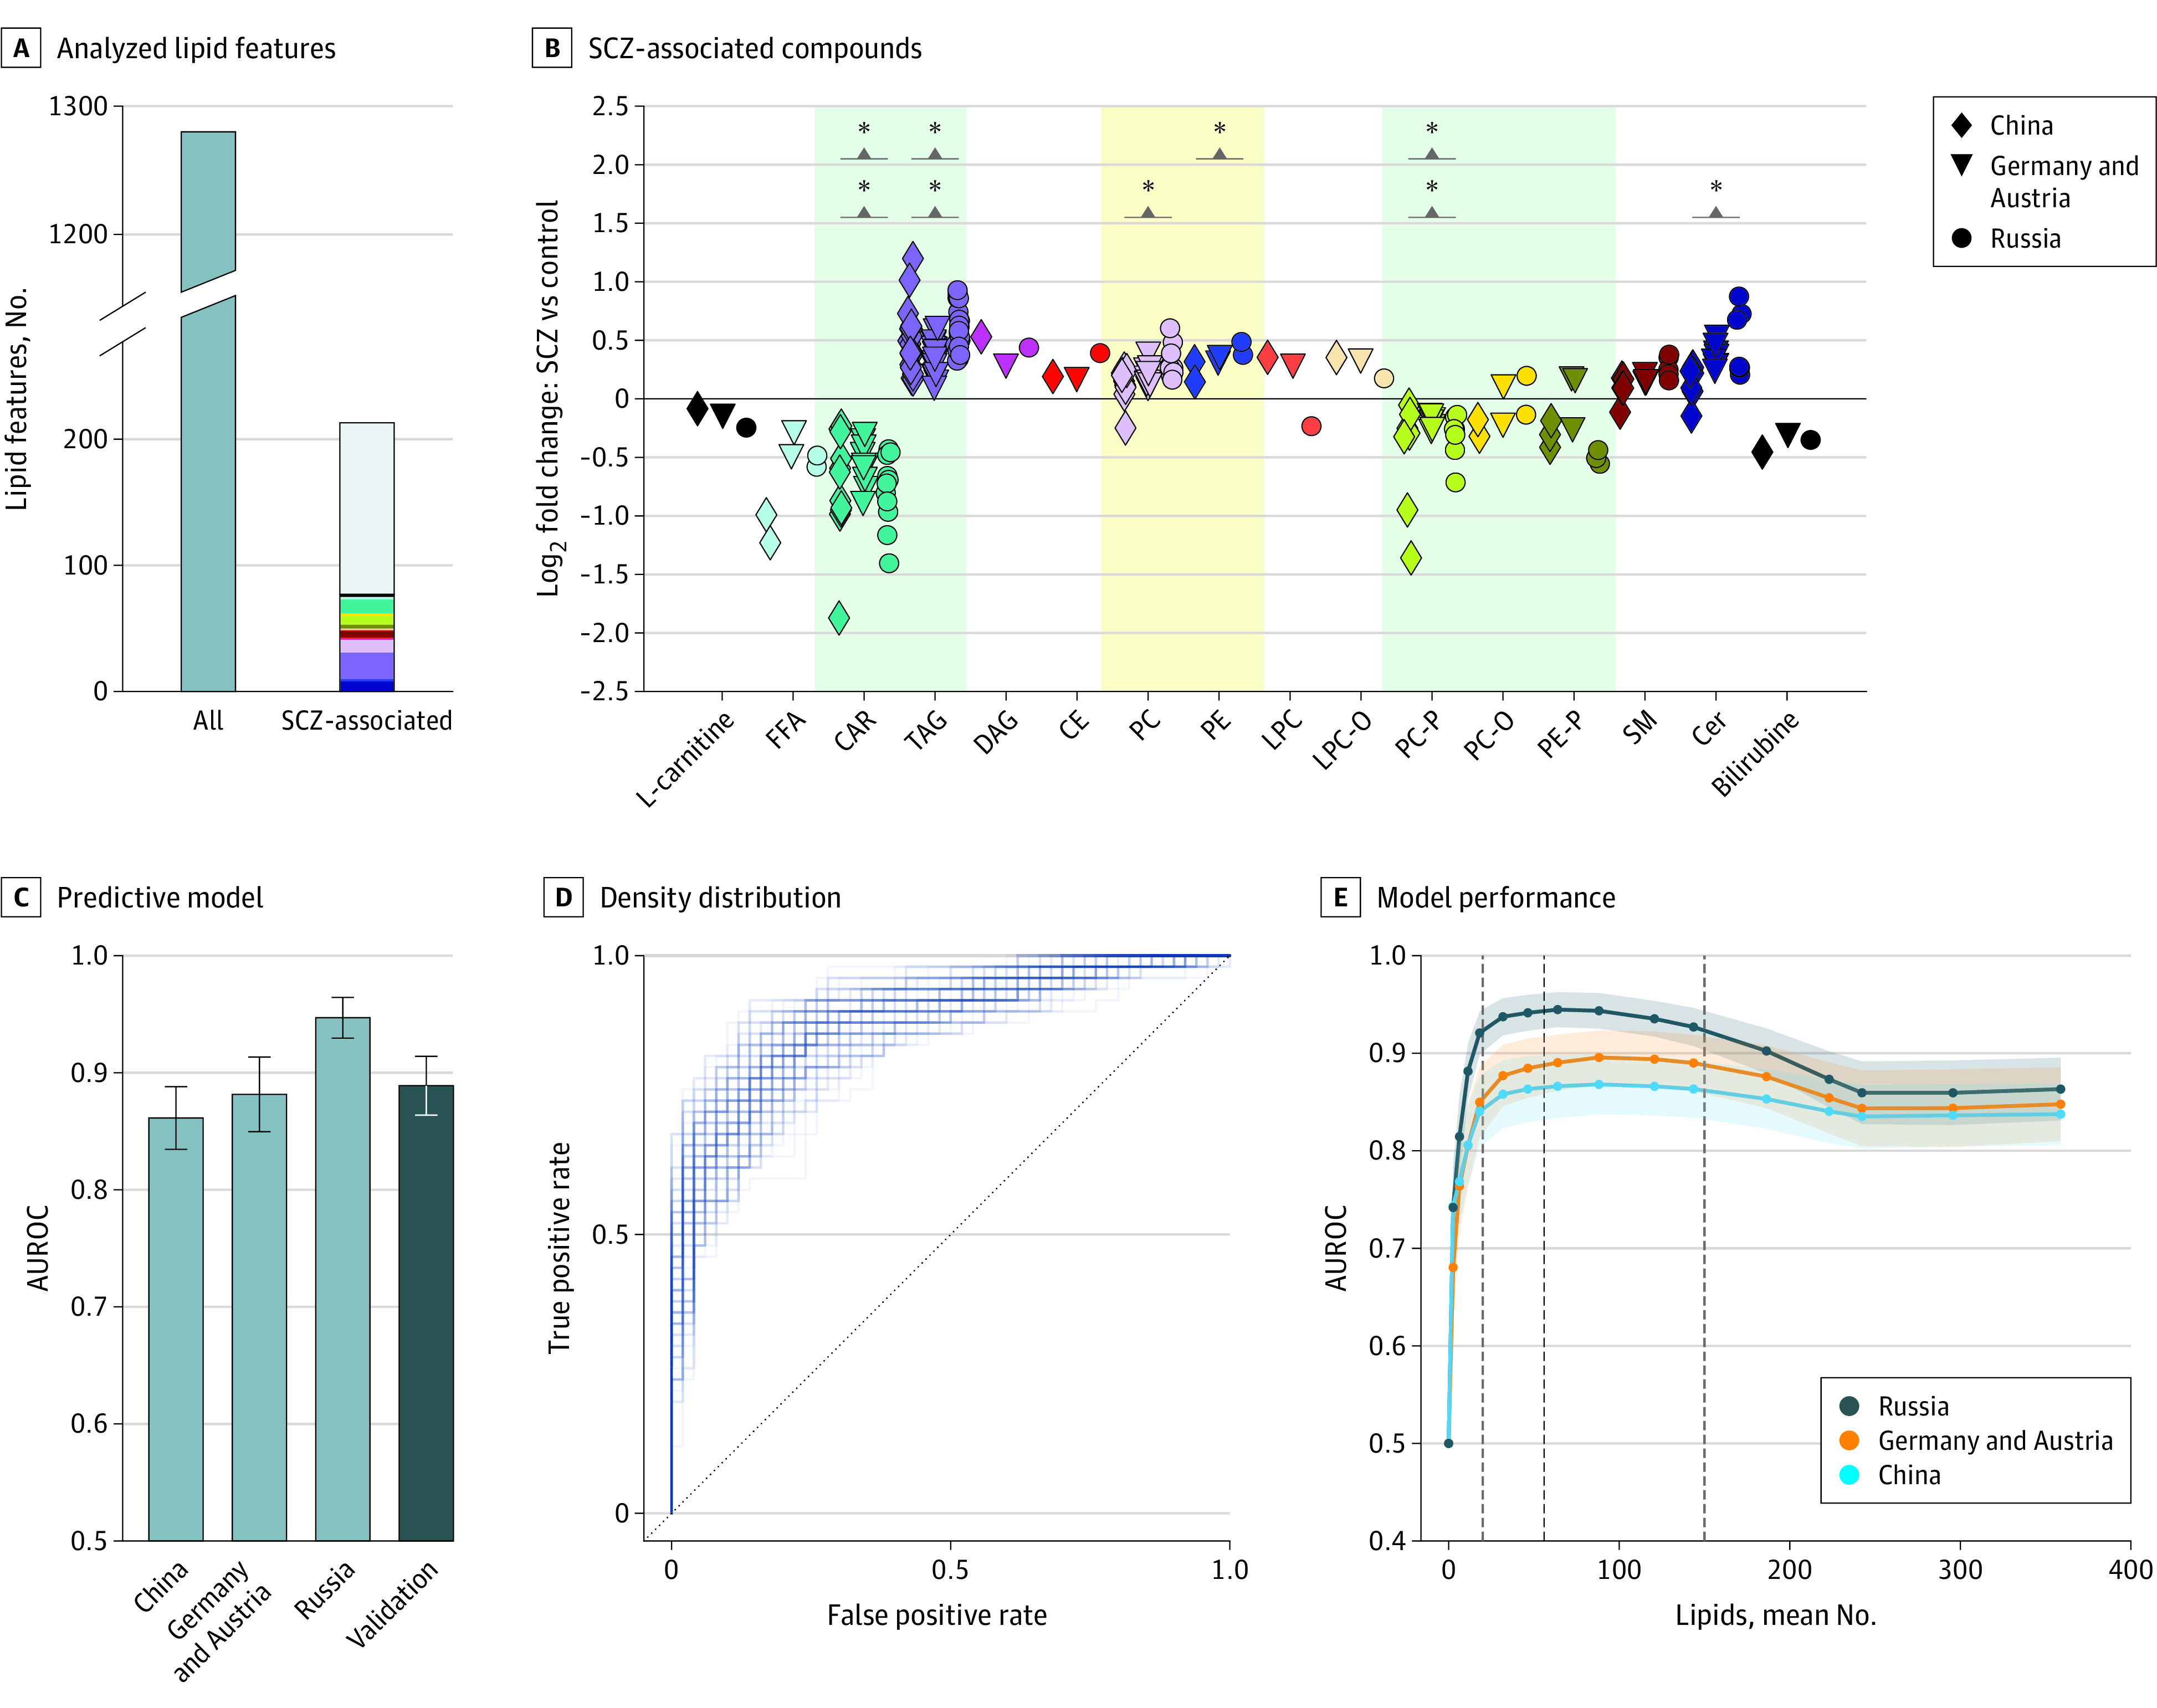
Figure 2. Schizophrenia (SCZ)-Associated Lipidome Alterations and Classification Modeling.

A, Numbers of all analyzed lipid features for all studied mental disorders and SCZ-associated lipids. The colors correspond to the lipid classes displayed in panel B. The y axis was broken to increase lipid class color visibility. B, The average lipid abundance log ratios between individuals with SCZ and control individuals for the 77 SCZ-associated compounds, sorted according to lipid classes. Asterisks denote significance at the lipid class level (eTable 7 in Supplement 1). Shading marks reported lipid class alterations in SCZ (eTable 2 in Supplement 1): green (good) and yellow (mixed) agreement without our results. C, Area under the receiver operating characteristic curve (AUROC) estimates for predictive model separating individuals with SCZ and control individuals. The model was trained on samples merged from China, Germany and Austria, and Russia, and tested separately on samples from China, Germany and Austria, Russia, and the cohort of patients with a first psychotic episode (fepRU; indicated as “Validation”) subsets. D, The density distribution formed by the individual AUROC curves of the models trained on different random subsets from the 3 primary cohorts and tested using fepRU samples. E, Model performance depending on the number of lipids used in the model. Lines correspond to mean performance in each cohort over 100 train/test splits. Shaded areas cover the estimated SDs. First dashed gray line denotes 20 features. Dashed black line indicates the mean number of features for the parameter C = 0.1. Second dashed gray line denotes 150 features. CAR indicates acylcarnitine; CE, cholesteryl ester; Cer, ceramide; DAG, diacylglycerol; FFA, free fatty acid; LPC, lysophosphatidylcholine; LPC-0, lysoplasmanyl-phosphatidylcholine; PC, phosphatidylcholine; PC-0, plasmanyl-phosphatidylcholine; PC-P, phosphatidylcholine plasmalogen; PE, phosphatidylethanolamine; PE-P, phosphatidylethanolamine plasmalogen; SM, sphingomyelin; TAG, triacylglyceride.
