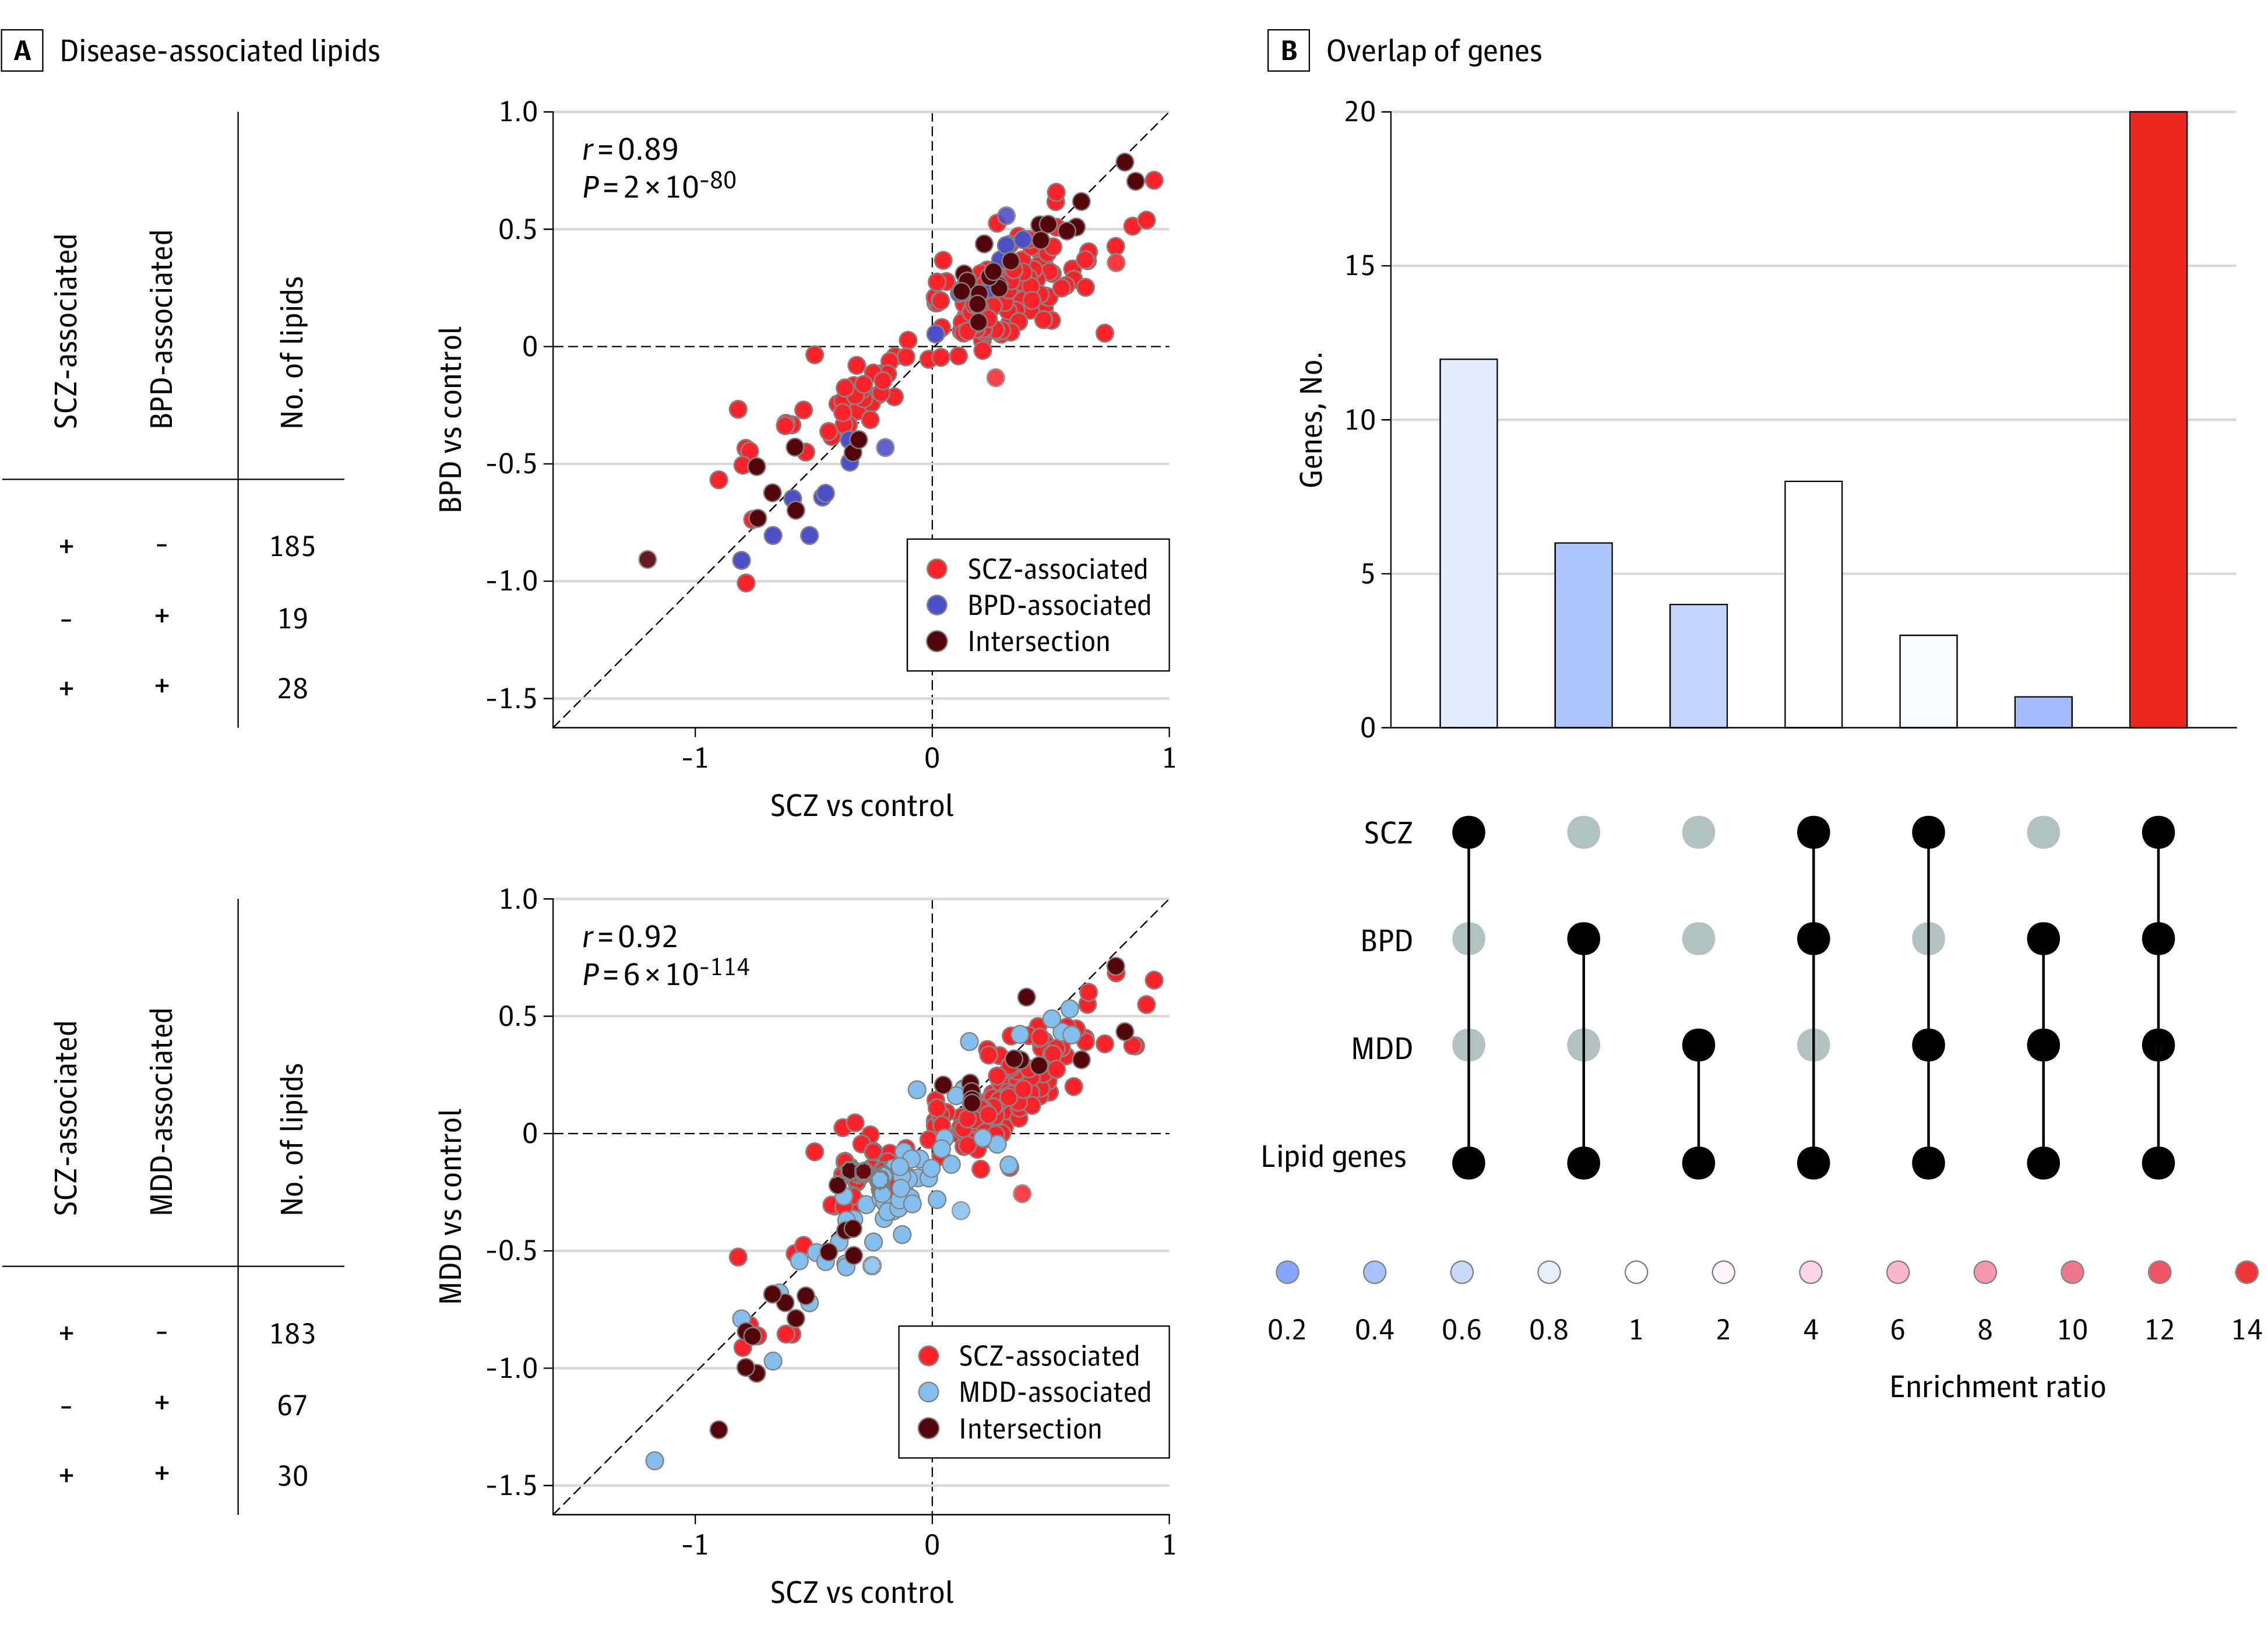
Figure 3. Comparison of the Blood Plasma Lipidome Alterations Among 3 Psychiatric Disorders.

A, Number of disease-associated lipids that are common (+ +) or different (− +, + −) for the disorders and pairwise comparisons of average lipid abundance log ratios (log2 fold-change) between the different disorders and controls. Log2 fold-changes were averaged for 3 (for schizophrenia [SCZ]) or 2 (for bipolar disorder [BPD] and major depressive disorder [MDD]) cohorts. Circles represent the SCZ-, BPD-, and MDD-associated lipid features, as well as their intersection. The diagonal line indicates y = x. B, Intersection of genes associated with SCZ, BPD, and MDD, considering only the subset of 84 genes linked to the blood plasma lipid level variation. Colors correspond to the fold of enrichment, calculated for each group by subsampling random groups of genes of the same size 1000 times.
