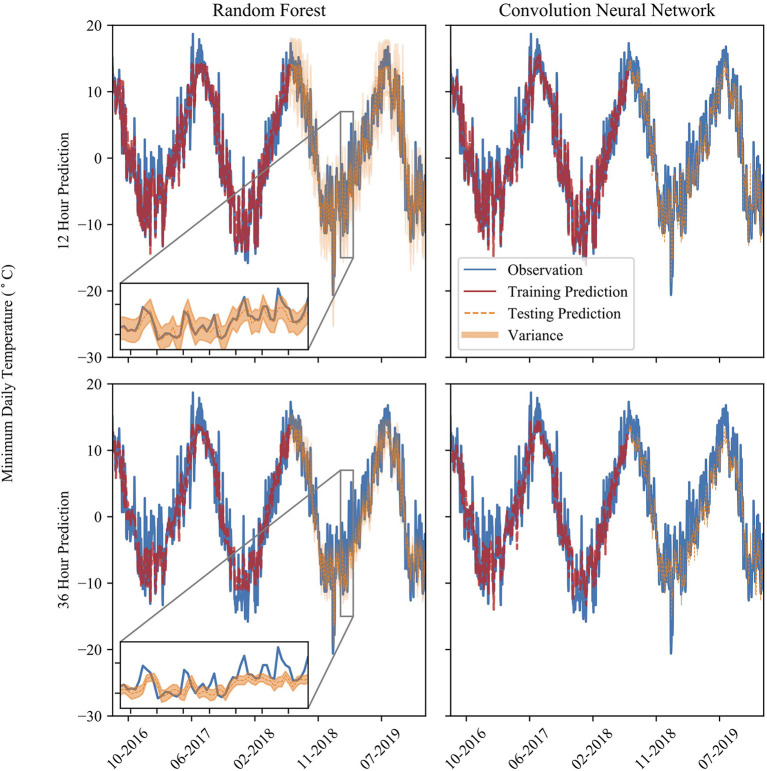
Figure 2.
The time series of temperature prediction and observation at various prediction times (over a span of 3 years) and models. Model predictions show both training and testing datasets. The inset shows a period of 50 days from 01/29/2019 to 03/20/2019. The orange band is the 90% confidence interval of the RF model predictions.

