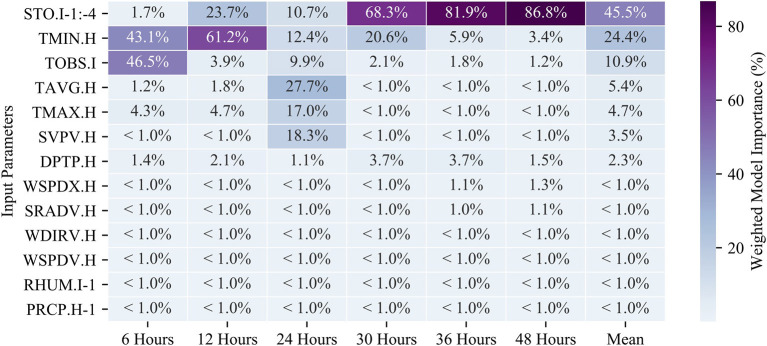
Figure 6.
A heatmap of the weighted model importance of the RF model features (as described in Table 1). The listed values are the sum of all feature importances for the given input parameter (the actual number of features is much larger after feature engineering on the time-series data). Each RF model (columns) add up to a total of 100%.

