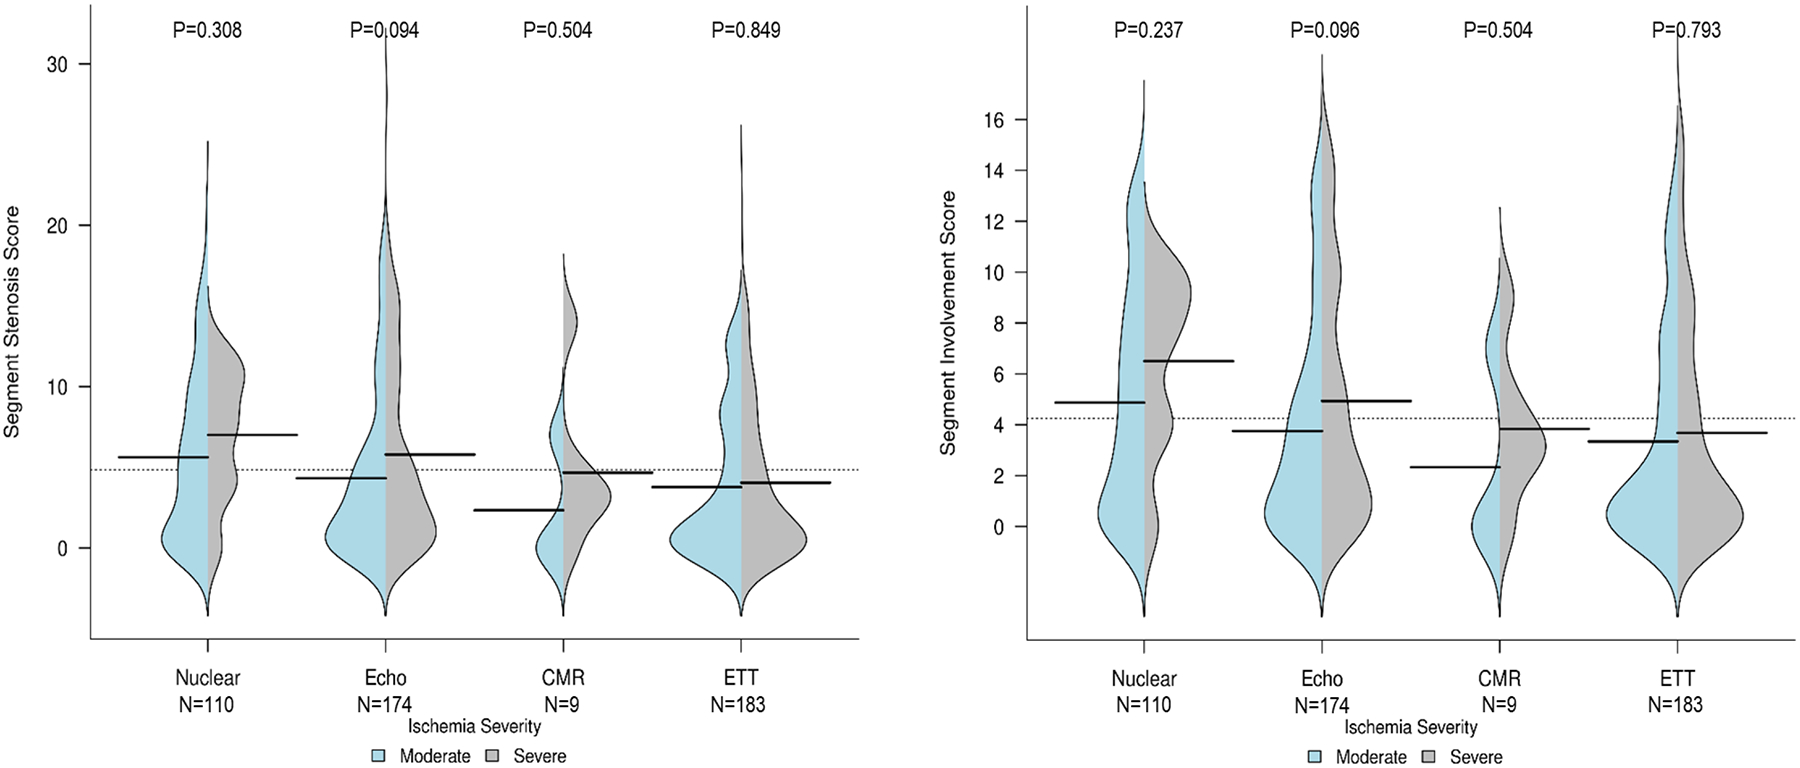
Figure 4. Relationship between severity of ischemia and extent and severity of non-obstructive stenosis on CCTA.

The bean plots show the severity of non-obstructive atherosclerosis as measured by the segment stenosis score (left) and the segment involvement score (right). For each bean, patients with moderate ischemia as determined by core laboratories are shown on the left in blue and those with severe ischemia in gray on the right. The median value is shown with a horizontal black line, and the width illustrates the frequency of each value on the y-axis. To calculate the segment stenosis score, each individual coronary segment was graded as having no to severe plaque (i.e., scores from 0–4) based on extent of obstruction of coronary luminal diameter. Then the extent scores of all 16 individual segments were summed to yield a total score ranging from 0–64. The segment involvement score was defined as the total number of coronary artery segments exhibiting plaque, irrespective of the degree of luminal stenosis within each segment (minimum=0; maximum=16). Data are presented for each stress testing modality.
P-values comparing segment stenosis score between participants with moderate vs. severe ischemia overall for each modality were all >0.05. The same was true for segment involvement score.
