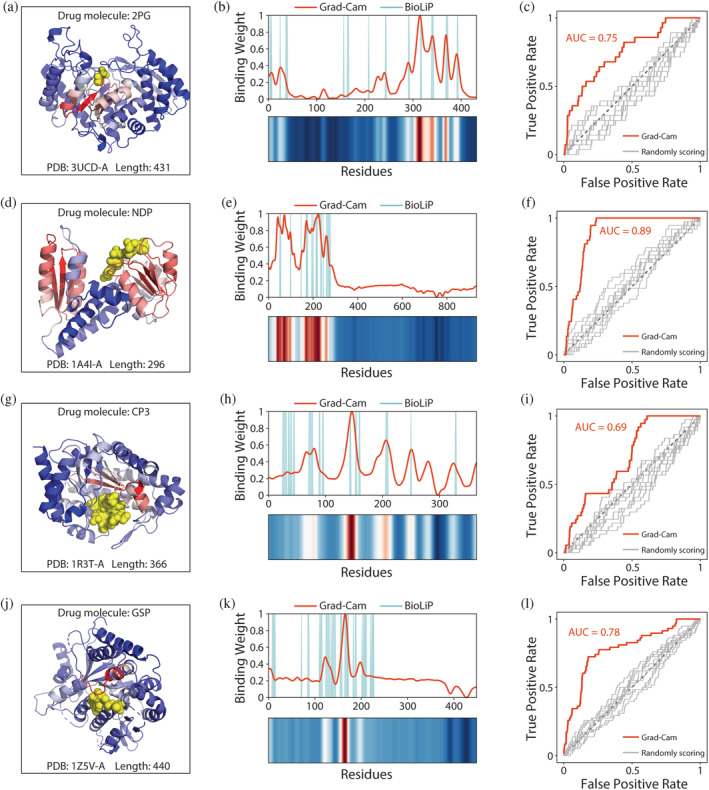
FIGURE 6.

Residue‐binding weights calculated by grad–cam match experimentally confirmed binding sites. (a) 3D conformation of 3UCD binding to the drug molecule 2PG. Yellow spheres represent drug molecules. Color of the cartoon indicates the residue‐binding weights calculated by grad–cam. Higher scored regions are shown in red, and lower scored regions are shown in blue. (b) Comparison between residue‐binding weights calculated by grad–cam and experimentally confirmed binding sites from BioLiP. Gaussian smoothing was performed for the residue‐binding weight curve. (c) ROC curves comparing predicted residue‐binding weights and true binding sites. Gray curves represent the residue‐binding weights obtained by random scoring. Results for the protein (d–f) 1A4I, (g–i) 1R3T, and (j–l) 1Z5V, analyzed as described in (a–c)
