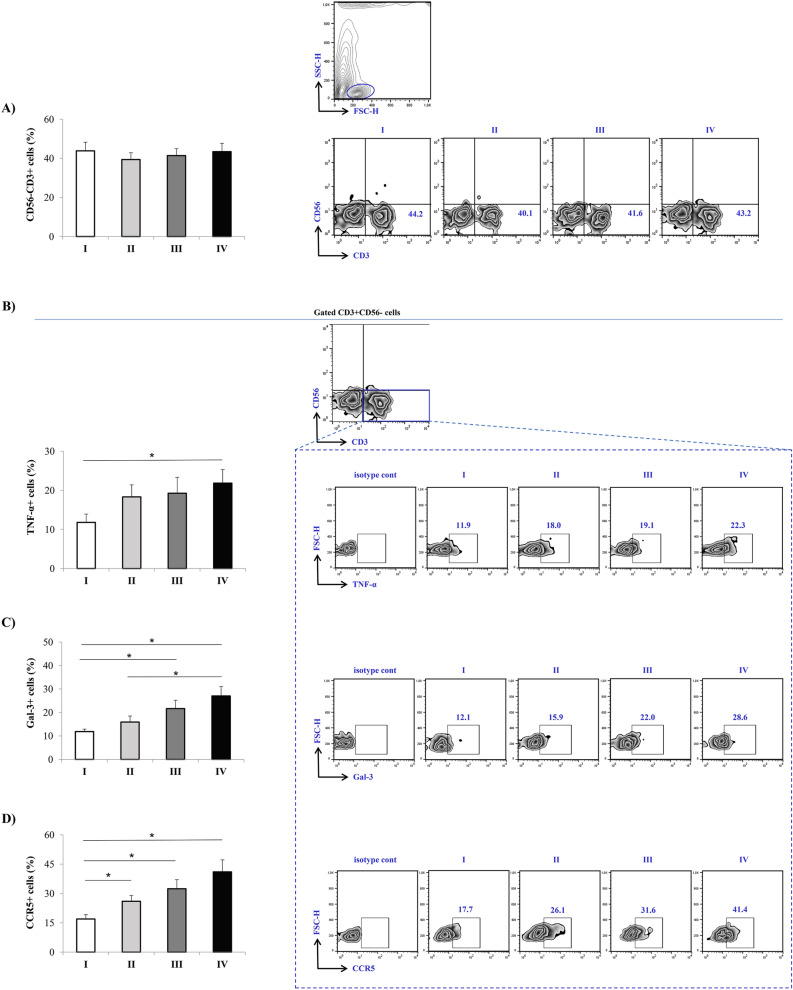
Figure 2.
Increment in percentage of TNF-α+, Gal-3+, and CCR5+ T cells in stage IV patients with COVID-19. The graph and representative FACS plots displaying the percentage of CD56-CD3+, CD56−CD3+ TNF-α+ cells, CD56−CD3+ Gal-3+ cells, CD56−CD3+ CCR5+ cells, among PBMCs of patients in all progressive stages of COVID-19 (stage I (n = 19), II (n = 21), III (n = 22), IV (n = 24). Isotype control for each measured marker is also displayed. The Kruskal–Walli’s test (with post-hoc Mann–Whitney U-test) was applied to evaluate statistically significant differences. *p < 0.05.

