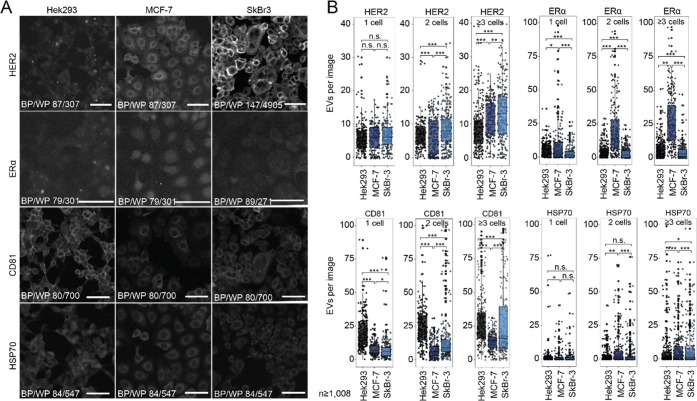
Figure 4.
EVs represent the phenotype of the cell of origin. (A) Immunocytochemical staining showing distinct expression profiles in SkBr-3, MCF-7, and HEK293 for HER2, of ERα, CD81, and HSP70. Scale bar 100 μm. (B) Dot plots depicting the absolute number of detected EVs per image when immobilized on anti-CD63 antibody. Separated by cell type, we detect EVs from wells with single, two, or three and more cells for all four investigated markers.

