
Figure 5.
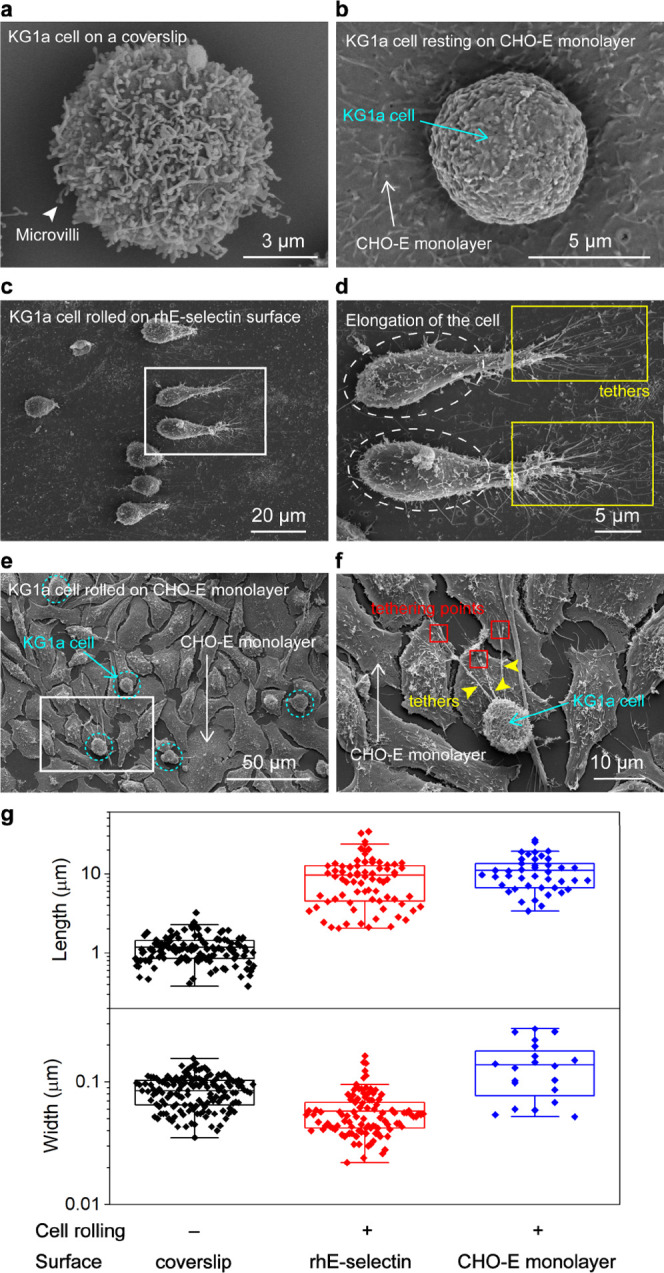
Scanning electron microscopy (SEM) characterization of nanoscopic morphology of KG1a cells during the cell rolling over the CHO-E monolayer. SEM images of KG1a cells deposited on the (a) coverslip and (b) CHO-E monolayer. (c) SEM image of KG1a cells rolled on a rh E-selectin-coated surface (0.2 μg mL–1) at a shear stress of 1 dyne cm–2. (d) Enlarged view of the area highlighted by the white box in panel (c). Tethers formed during the cell rolling are highlighted by yellow boxes. Elongation of the KG1a cells is highlighted by ellipses. (e) SEM image of KG1a cells rolled on the CHO-E monolayer at a shear stress of 2 dyne cm–2. KG1a cells are highlighted by circles. (f) Enlarged view of the area highlighted by the box in panel (e). Tethers formed during the cell rolling are highlighted by arrowheads. Tethering points are highlighted by red squares. (g) Box plots showing the length (top) and width (bottom) of the tethers and slings captured by SEM measurements.