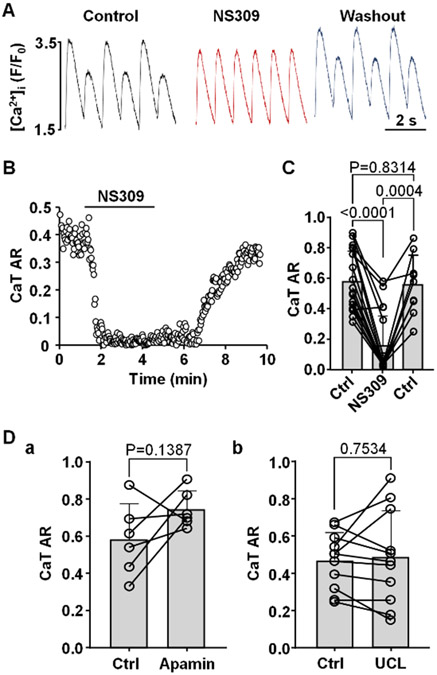
Fig. 3. Activation of SK channels abolishes CaT alternans.
A: CaT traces recorded from the same ventricular myocyte in control, in presence of SK channel activator NS309 (2 μM) and after washout of NS309. CaT alternans was induced by increasing pacing frequency in field stimulated ventricular myocytes.
B: CaT AR monitored over time in control and during SK activation calculated from CaT data in panel A.
C: Mean and individual cell CaT AR values in control (Ctrl), during NS309 exposure (2 μM; n/N=18/6) and after washout in a subset of cells (n/N=9/3). Statistical analysis was performed using Tukey’s multiple group comparison test.
D: CaT ARs recorded in field stimulated ventricular myocytes in control and after application of SK channel blockers (a) apamin (n/N=6/2; paired t test) and (b) UCL1684 (n/N=11/3; paired t test).

