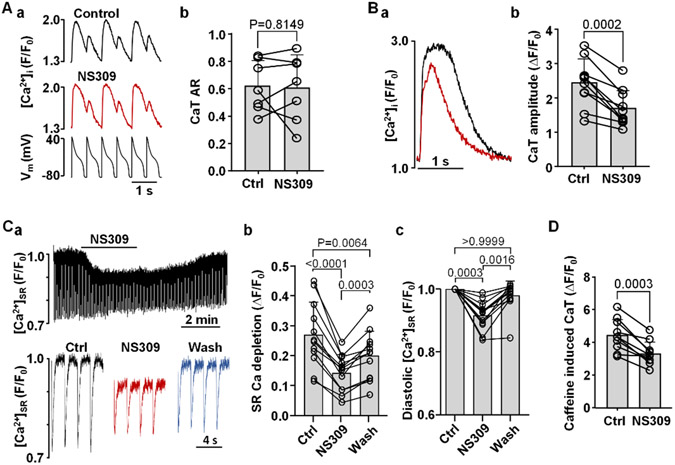
Fig. 8. Effect of SK channel activation on CaT alternans in AP voltage-clamped myocytes, CaT amplitude and SR Ca2+ load.
A: (a) CaT traces recorded in control and in the presence of NS309 in AP voltage-clamped myocytes (bottom trace: AP voltage commands). (b) Individual cell and mean CaT ARs recorded in AP-clamped ventricular myocytes in control and in the presence of NS309 (2 μM). Under AP-clamp conditions the SK channel activator had no effect on CaT AR (n/N=7/3; paired t test).
B: (a) Overlay of CaTs recorded from the same field stimulated (0.5 Hz; no alternans) ventricular myocyte in control (black) and in NS309 (red). (b) Individual cell and mean CaT amplitudes (ΔF/F0) before and during application of NS309 (n/N=10/3, paired t test).
C: (a) [Ca2+]SR traces recorded in a ventricular myocyte loaded with the low affinity Ca2+ dye Cal520N/AM and field stimulated at 0.5 Hz. Top trace shows changes of [Ca2+]SR over the course of the experiment in control, during application of 2 μM NS309 and during washout of the drug. Bottom: depletions of [Ca2+]SR recorded in control, in NS309 and during washout. (b) Individual and mean amplitudes of [Ca2+]SR depletions recorded in control, in NS309 and during washout (n/N=12/2, Tukey’s multiple group comparison test). (c) Individual and mean changes in diastolic [Ca2+]SR (n/N=12/2, Dunn’s multiple group nonparametric comparison test).
D: Amplitudes of caffeine (10 mM) induced CaTs before and during application of NS309 demonstrating reduced SR Ca2+ load in the presence of NS309 (n/N=10/3; paired t test).

