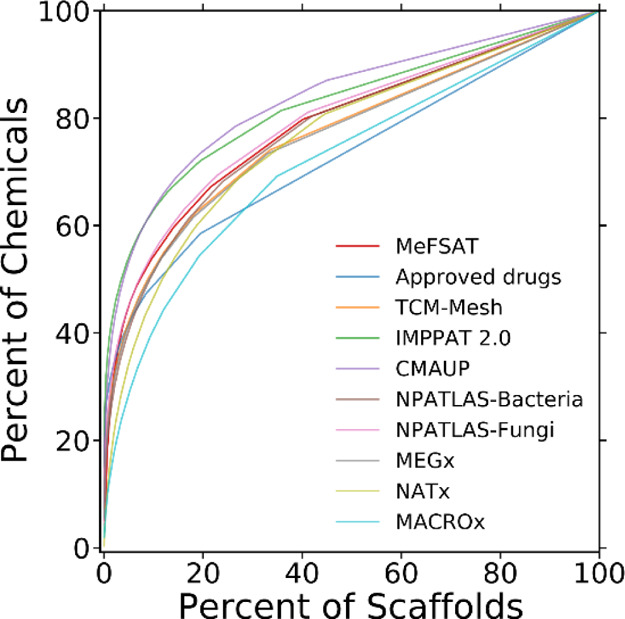
Figure 3.

CSR curves for 10 different chemical libraries considered in this study. Note that a CSR curve close to the diagonal line indicates high scaffold diversity. The two metrics, namely, the AUC and the percentage of scaffolds required to retrieve 50% of chemicals (P50), derived from the CSR curves, also enable quantitative comparison of the scaffold diversity between chemical libraries.
