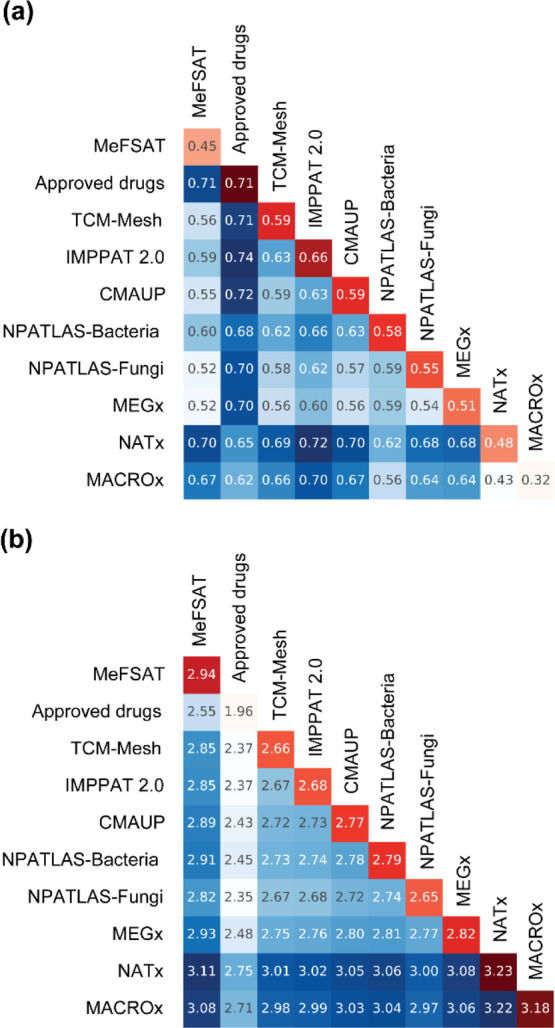
Figure 5.

THPs for the chemical libraries analyzed here. (a) THP based on Soergel distance using MACCS key fingerprints and (b) THP based on Euclidean distance of molecular properties. The off-diagonal cells show the inter-library distance and are colored in gradients of blue. Dark blue indicates low similarity and light blue indicates high similarity between libraries. The diagonal cells show the intra-library diversity and are colored in gradients of red. Dark red indicates high diversity and light red indicates low diversity within the library.
