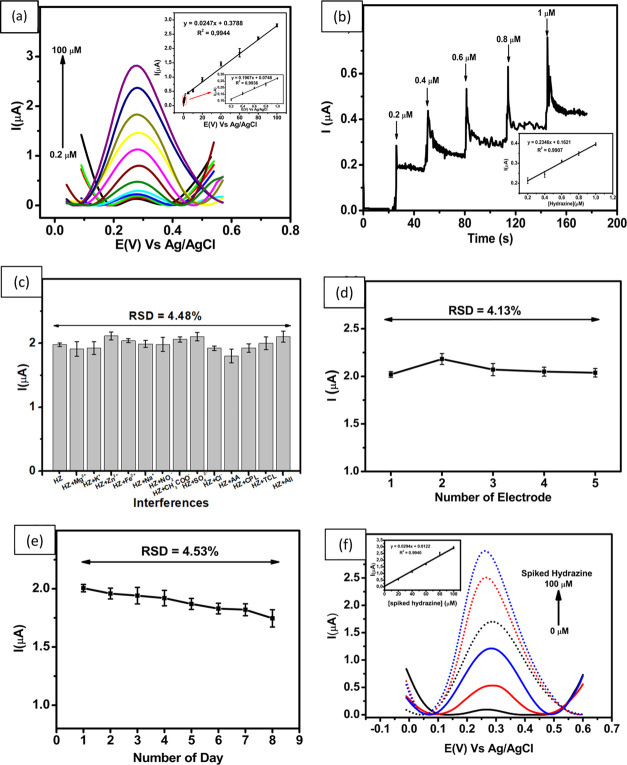
Figure 5.
(a) DPV curves obtained from different concentrations of hydrazine (0.2–100 μM), (b) Chronoamperograms in the presence of 0.1 M buffer phosphate at pH 7.0 for the detection of hydrazine at different concentrations. Inset: linear relationship between peak current and the various concentrations of hydrazine, (c) Variation in the response current in the measurement of hydrazine in the presence of several interferences and combined interferences when measured with ErGO/PEDOT:PSS-modified GCE, (d) Reproducibility of the hydrazine measurements at a concentration of 60 μM using five different electrodes, (e) Stability of hydrazine measurements at a concentration of 60 μM over 8 consecutive days, and (f) DPV of hydrazine determination from the river water sample by the standard addition method in the concentration range of 0–100 μM. Inset Figure: linear relationship between the spiked concentration of hydrazine with the peak current.

