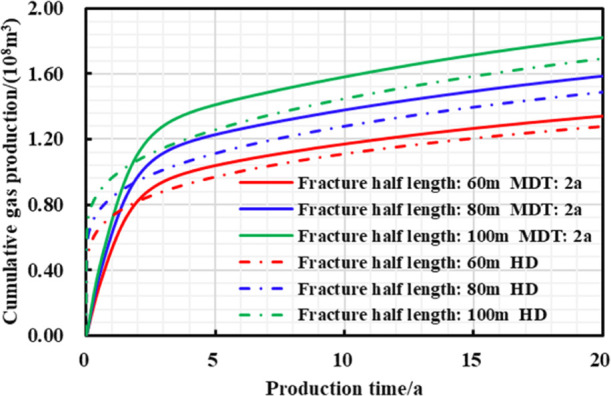
Figure 25.

Chart of cumulative gas production and production time with different production strategies under different hydraulic fracture half lengths.

Chart of cumulative gas production and production time with different production strategies under different hydraulic fracture half lengths.