Figure 4.
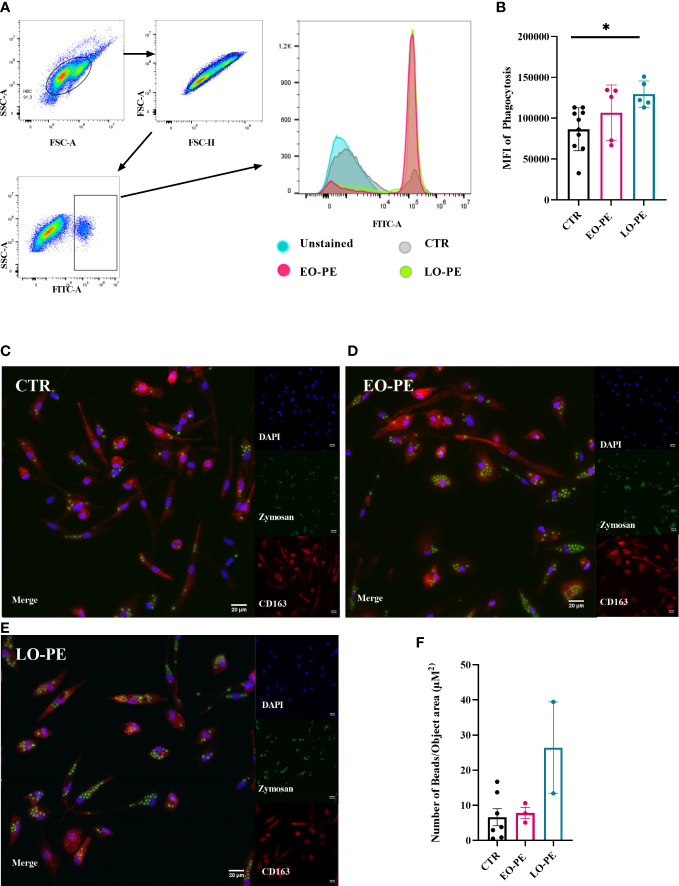
PE HBCs possess a higher phagocytic capacity. (A) Gating strategy cells for the measurement of phagocytosis. Cells were separated by size using forward and size scatter (FSC and SSC, respectively), followed by doublet discrimination and gating against SSC-area and FITC -A fluorescent signal. Histograms of one representative experiment are shown, in total 10 CTR, 5 EO-PE and 5 LO-PE HBCs were used. (B) Quantification of median fluorescence intensity (MFI) of phagocytosis measured with FACS. (C) Visualization of phagocytosis with high content screening microscopy (HCS). HBCs were treated with zymosan beads (green) and co-stained with CD163 (red), DAPI was used to stain nuclei. Representative images of individual experiments are shown. To visualize phagocytosis CTR (C, n=7), EO-PE (D, n=3) and LO-PE (E, n=2) isolations were used. Scale bar represents 20µM. (F) Quantification of the phagocytosis measured with high content screening. Analysis was carried out with NisViewer Software, analyzing the number of beads within the CD163 positive HBC cell. All data in (B, F) are presented as mean ± S.E.M, ANCOVA with adjustment for gestational age with Sidak’s post-hoc test was used for to test statistical significance. *p ≤ 0.05.

