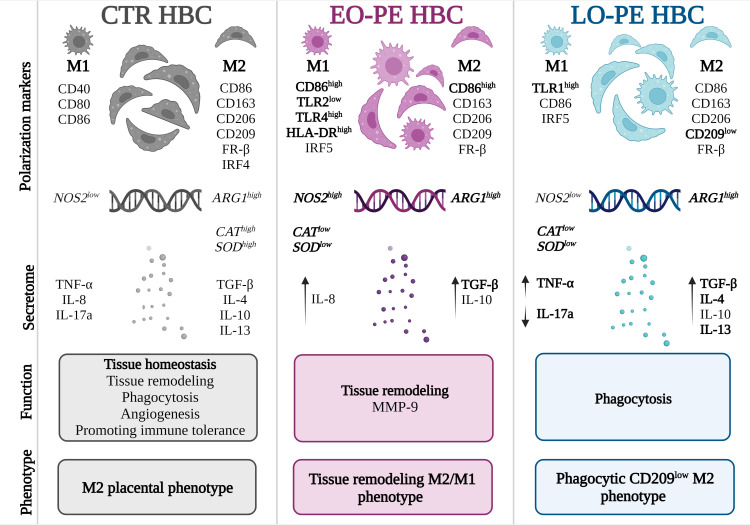
Figure 6.
Different polarization patterns of CTR, EO - and LO-PE HBCs. HBCs isolated from CTR placenta develop a specific placental phenotype and express both M1 and M2 polarization markers. In CTR placenta, their M2 nature is reflected by increased expression of ARG1, CAT, and SOD, where HBCs promote tissue repair, angiogenesis, and homeostasis. Our results suggest that EO-PE HBCs develop an M2 phenotype that is strongly shifted toward M1 polarization. Their M2 phenotype is reflected in the upregulation of ARG1, secretion of TGF-β, and tissue remodeling function, whereas features of M1 polarization are seen in the increased expression of TLR4, HLA-DR, IRF5, and NOS2. In contrast, LO-PE HBCs tend to develop a phagocytic CD209low M2 phenotype with increased production of IL-4, IL-13, and TGF-β. However, the higher expression of TLR1 and increased production of TNF-α indicate a specific pro-inflammatory pattern that differs from the typical M2 polarization. The figure was generated using BioRender. Differences that were significant different between the groups studied are printed in bold.

