FIGURE 4.
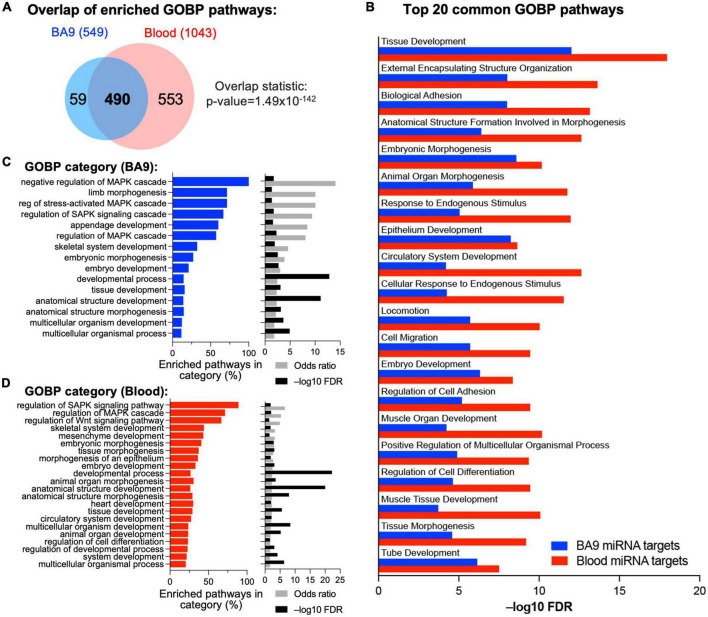
Integrative analysis of miRNA–mRNA networks. (A) Pathway enrichment was carried out with the enriched gene targets of BA9 and blood miRNAs using the Gene Ontology Biological Processes compendium, with overlap of enriched pathways shown as a Venn diagram. (B) Top 20 common GOBP pathways between BA9 and blood miRNA targets. (C) List of GO terms enriched in the 549 significant pathways in BA9 miRNA targets. (D) List of GO terms enriched in the 1,043 pathways significant in blood miRNA targets. For panels (C,D), the percent of pathways associated with a GO term, odds-ratio, and –log10(FDR) are shown.

