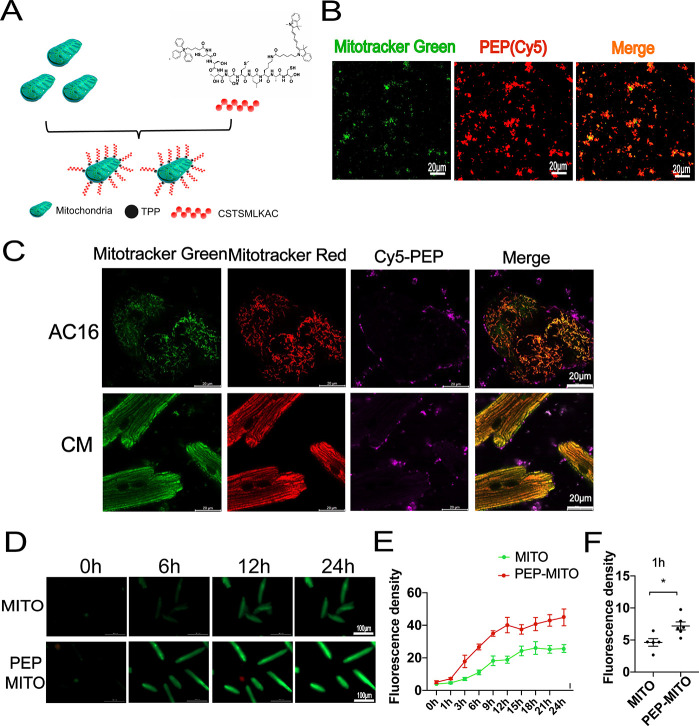
Figure 2.
Conjugation process and characteristic analyses of targeting peptide and mitochondria. (A) Schematic diagram of peptide and mitochondrial conjugation. (B) Representative confocal images before and after the combination of isolated mitochondria with PEP(Cy5). Scale bar = 20 μm. Mitochondria were labeled with MitoTracker Green. (C) In vitro analyses of the internalization process of mitochondria and peptide compound into AC16 and cardiomyocytes. Transplanted mitochondria were labeled with MitoTracker Green. AC16 and adult cardiomyocytes were stained with MitoTracker Red. Scale bar = 20 μm. (D–F) Dynamic internalization of mitochondria into with or without peptide conjugation into cardiomyocytes. Mitochondria was labeled with MitoTracker Green. Scale bar = 100 μm. Mean ± SEM, *P < 0.05. Statistical analysis was carried out by a one-way ANOVA analysis followed by Tukey’s test for post hoc analysis.

