Figure 5.
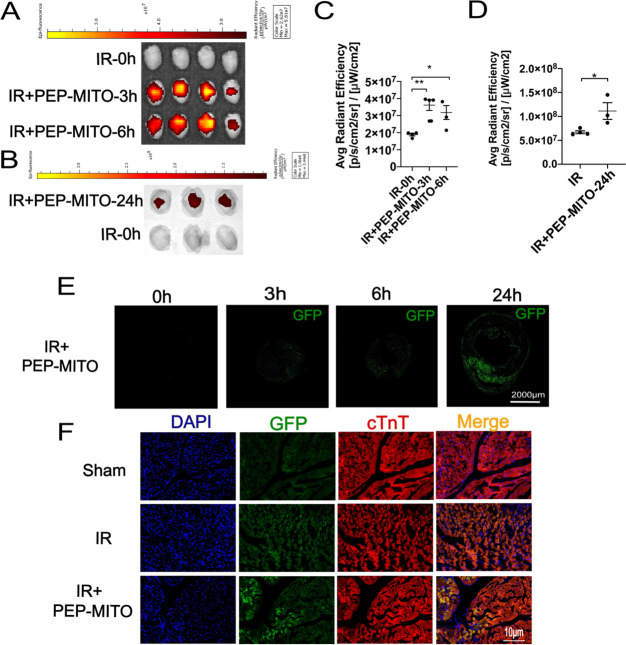
Cardiac location of PEP(Cy5)–TPP–mitochondria after transplantation in IR mice heart. (A) Representative hearts in each group for the Cy5 location of transplanted mitochondria in the myocardium at 3 and 6 h (red fluorescence). (B) Representative hearts in each group for the GFP fluorescent location of transplanted mitochondria in the myocardium at 24 h (green fluorescence). (C) Statistical analysis of average radiant efficiency of Cy5 after PEP–TPP–mitochondrial transfer for 3 and 6 h. (D) Statistical analysis of average radiant efficiency of GFP after PEP–TPP–mitochondrial transfer for 24 h. (E) GFP fluorescence imaging of frozen section from IR heart tissue after PEP–TPP–mitochondrial transfer for 0, 3, 6, and 24 h. Scale bar = 2000 μm. (F) Fluorescent colocalization imaging of GFP–mitochondria and cTnT–cardiomyocytes after PEP(Cy5)–TPP–mitochondria transplantation for 24 h. Mean ± SEM, *P < 0.05, **P < 0.01. Statistical analysis was carried out by a one-way ANOVA analysis followed by Tukey’s test for post hoc analysis.

