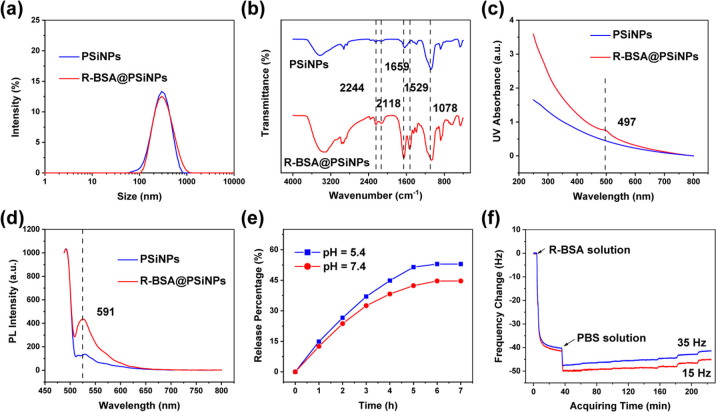
Figure 4.
(a) Hydrodynamic size plots, (b) FTIR spectra, (c) UV–vis spectra, and (d) PL spectra excited with 488 nm of PSiNPs and R-BSA@PSiNPs nanocomposites; (e) release profile of R-BSA from R-BSA@PSiNPs nanocomposites under different conditions of pH = 5.4 or 7.4.; and (f) real-time frequency changes of the association and dissociation of R-BSA with PSiNPs.

