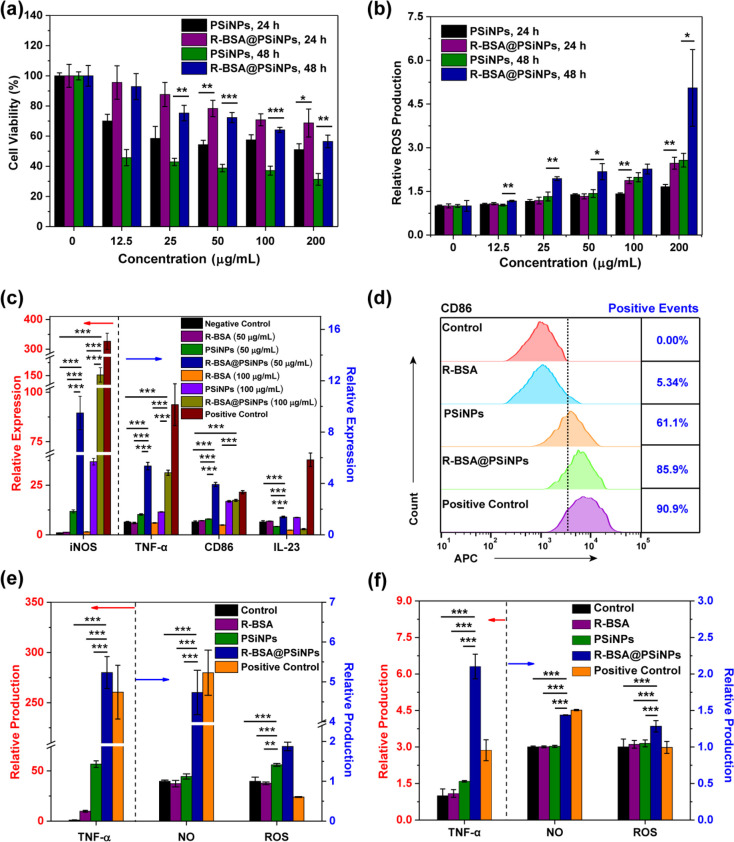
Figure 5.
(a) Viability of RAW 264.7 cells treated with PSiNPs or R-BSA@PSiNPs at the concentration range of 0–200 μg/mL for 24 or 48 h (n = 6 biological independent samples); (b) ROS production of RAW 264.7 cells with PSiNPs or R-BSA@PSiNPs at the concentration range of 0–200 μg/mL for 24 h (n = 4 biological independent samples); (c) relative gene expression of iNOS, TNF-α, CD86, and IL-23 in RAW 264.7 cells treated with 50 or 100 μg/mL R-BSA@PSiNPs, 50 or 100 μg/mL PSiNPs, or R-BSA at the equivalent concentration for 24 h, untreated RAW 264.7 cells as a control, and ones stimulated by LPS + IFN-γ as a positive control (n = 3 biological independent samples); and (d) the positive events of CD 86 expression by flow cytometry in RAW 264.7 cells treated with 100 μg/mL R-BSA@PSiNPs, 100 μg/mL PSiNPs, or R-BSA at the equivalent concentration for 24 h, untreated RAW 264.7 cells as a control, and ones stimulated by LPS + IFN-γ as a positive control; (e) production of TNF-α, NO, and ROS in RAW 264.7 cells treated with 100 μg/mL R-BSA@PSiNPs, 100 μg/mL PSiNPs, or R-BSA at the equivalent concentration for 24 h, untreated RAW 264.7 cells as a control, and ones stimulated by LPS + IFN-γ as a positive control (n = 4 biological independent samples); and (f) the production of TNF-α, NO, and ROS in peritoneal macrophages harvested from mice with the intraperitoneal injection of 200 μL of R-BSA@PSiNPs (20 mg/kg), 200 μL of PSiNPs (20 mg/kg), R-BSA and at the equivalent concentration, 200 μL of PBS as a control, and 200 μL of LPS (0.5 mg/kg) as a positive control (n = 5 biological independent samples). Error bars are based on standard errors of the mean (***P < 0.001, **P < 0.01, or *P < 0.05 by ANOVA with Tukey’s post-test).

