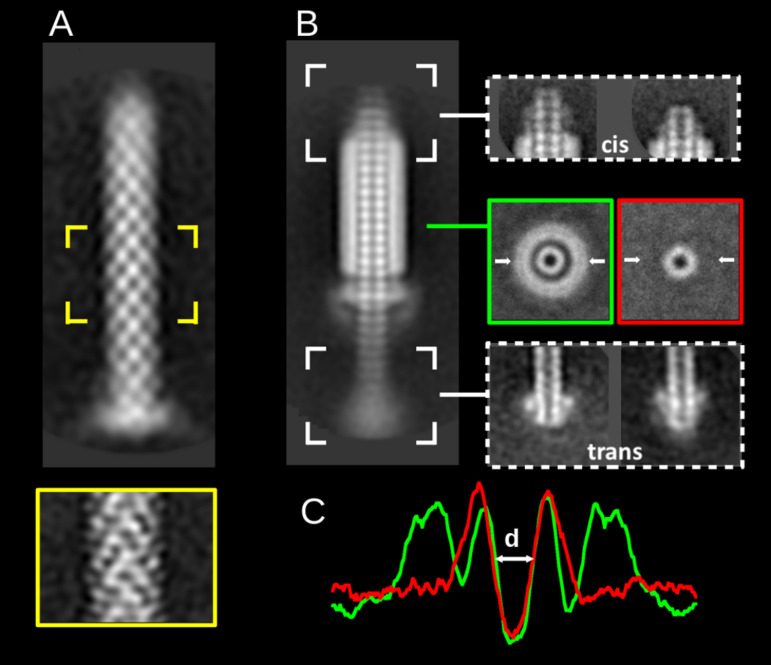
FIG 3.
Negative-stain transmission electron micrographs of fonticin particles analyzed by 2D class averaging classification. (A) Fonticin particle in its noncontracted native form (n = 649) and the middle part at a higher resolution (n = 783, highlighted in yellow). (B) Fonticin particle in the contracted form (n = 586) with averaged top view (highlighted in green rectangle) and the top view of separated tube (red rectangle). The top (cis) and the bottom (trans) ends of contracted particle are shown, both in two representative classes. The white arrows denote the section of diameter quantification. (C) Densitogram used for the quantification of the inner diameter of fonticin particle. The value of d = 4.1 ± 0.5 nm was calculated for the cross-section of the top views.

