Fig. 2.

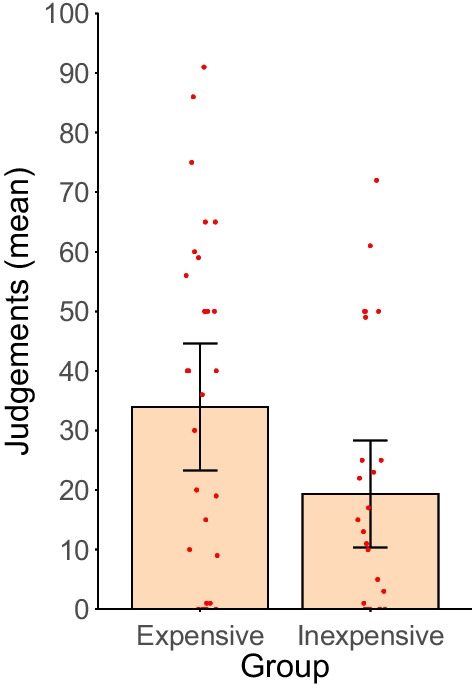
Judgements for the inexpensive and the expensive drug. Note. Bars represent the mean judgements for each group. Error bars depict the 95% confidence intervals for the means. Dots indicate the individual data of each participant

Judgements for the inexpensive and the expensive drug. Note. Bars represent the mean judgements for each group. Error bars depict the 95% confidence intervals for the means. Dots indicate the individual data of each participant