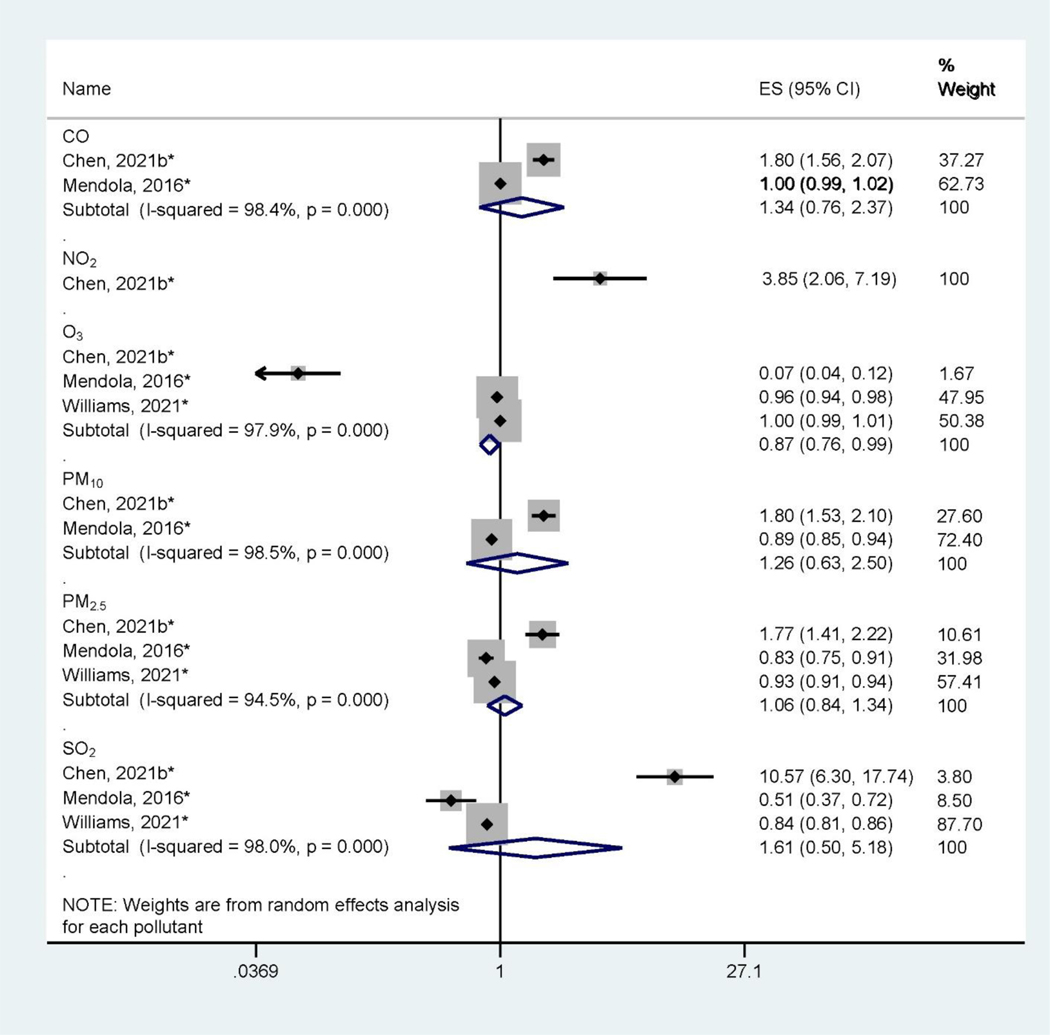
Figure 3.
Forest Plot Showing the Associations of Preconception Air Pollution Exposure with Preterm Birth per 10 μg/m3 (for PM2.5 and PM10) or 10 ppb (for NO2, SO2, and O3) or 100 ppb (for CO) increase in 3-month Preconception Average Concentration. (ES: effect size; CI: confidence interval). *Indicating converted effect size from the original article

